Economic Values
Topics
4 min read
Economic values (EV's) are an estimate of the dollar value to a NZ dairy farmer of a unit change in each trait. Ten traits have been identified as having a measurable economic value to NZ farmers. Economic values represent the dollar value of a one-unit increase in one of the nine traits as if all the other trait values were held constant.
Ten traits have been identified as having a measurable economic value to NZ farmers. The breeding values are multiplied by their respective economic values to produce the index Breeding Worth (BW).
Economic values represent the dollar value of a one-unit increase in one of the ten traits as if all the other trait values were held constant.
The economic values are applied on a 'profit per unit' basis. For example, one additional kg of protein creates $6.83 of additional profit for a dairy farmer when all other trait values remain the same.
The ten traits in BW can be categorised as representing either 'Production efficiency' or 'Robustness' traits.
| Trait categorisation | Trait (units) | Dec 2023 | Dec 20221 | Dec 2021 |
| Economic value ($/unit change) | ||||
| Production efficiency | Milkfat ($/kg) | 4.85 | 5.18 | 5.18 |
| Milk protein ($/kg) | 6.83 | 5.21 | 5.21 | |
| Milk volume ($/L) | -0.10 | -0.0951 | -0.0951 | |
| Liveweight ($/kg) | -1.59 | -1.38 | -1.38 | |
| Robustness traits | Somatic cell score ($/SCS) | -46.21 | -42.89 | -42.89 |
| Fertility ($/CR42) | NA2 | 6.2443 | 6.33 | |
| Fertility ($/PR42) | 5.772 | NA | NA | |
| Gestation length ($/day) | -1.89 | -0.8223 | NA | |
| Functional survival ($/%) | 1.88 | 2.65 | 2.65 | |
| Body Condition Score ($/unit) | 164.09 | 116.93 | 116.93 | |
| Udder overall4 | 0.00 | 0.00 | 0.00 | |
1 In December 2022, The Economic Values were not updated from the December 2021 values as they represented inflation but not the corresponding rising costs.
3 From March 2023, The trait “Fertility” was adjusted for Gestation Length and Gestation Length was included as a 10th trait in BW.
4 Udder Overall is a non-linear value. See Dollar contributions to BW for Udder Overall BV for more information.
Calculations of economic values account for milk production, historical and current milk prices, income from culls, surplus cows and calves, the cost of feed, the cost of generating replacements and general dairy farm expenses.
For some traits a one-unit increase is associated with an increase in profit, other times it is associated with a decrease in profit.
Examples of traits where an increase in the breeding value is associated with an increase in profit are milk fat yield, milk protein yield, fertility, functional survival, body condition score and udder overall. In other words, higher breeding values for these traits are better for farm profit.
Examples of traits where an increase in the breeding value is associated with a decrease in profit are milk volume, liveweight, gestation length, and somatic cell count. In other words, lower breeding values for these traits are better for farm profit.
The economic values for milk fat yield, milk protein yield and milk volume account for the income associated with higher production as well as the feed costs required to produce each milk component. Economic values are calculated using five-year averages of the milksolids price paid, the volume charge and the value component ratio (VCR).
The VCR is used to partition the milksolids price into a value for milk fat yield and a value for milk protein yield.
To calculate the economic value of specific milk components, we account for:
The liveweight economic value accounts for maintenance requirements and feed costs associated with growing and maintaining heavier animals as well as the extra income associated with cull cow value and the value of their calves.
The economic value for somatic cell accounts for decreased costs associated with less clinical mastitis, less penalties due to bulk somatic cell counts and better survival of cows with lower somatic cell counts.
The economic value for somatic cell accounts for:
The economic value for fertility includes value gained through increased longevity and value gained through earlier calving dates of more fertile cows.
The economic value accounts for:
Early calving dates - cows and heifers with high fertility contribute a much tighter pattern of calving across the herd, and they themselves generally have longer lactations. This value is offset slightly by the cost of increased feed demand in early spring.
The economic value for functional survival recognises that animals with better longevity independent of low production or poor fertility will reduce the requirement for replacement heifers.
The economic value accounts for:
The economic value for BCS represents the improved profitability of an animal that can maintain body condition over her lactation.
Cows that lose body condition easily incur costs in two key ways:
The economic value for udder overall represents the improved profitability of an animal that has superior udder conformation.
Cows with poor udder conformation incur costs in three key ways:
Udder overall has been incorporated in BW with a non-linear economic value in order to clearly show the impact of diminishing returns as udder overall improves between cows. The difference in the profitability of a cow with an average udder vs a cow with very poor udder is much more than the difference in profitability between a cow with an average udder and a cow with a really good udder.
Unlike the other eight traits in BW where all animals have the same economic value applied regardless of their breeding value, the dollar contribution to BW from udder overall is calculated using a slightly different economic value depending on their udder overall breeding value.
We can see in the graph that an udder overall BV less than zero results in a penalty to BW, whereas an udder overall BV greater than zero results in a reward to BW. By using the non-linear EV for udders, we can penalise lower breeding value animals more than rewarding higher breeding value animals.
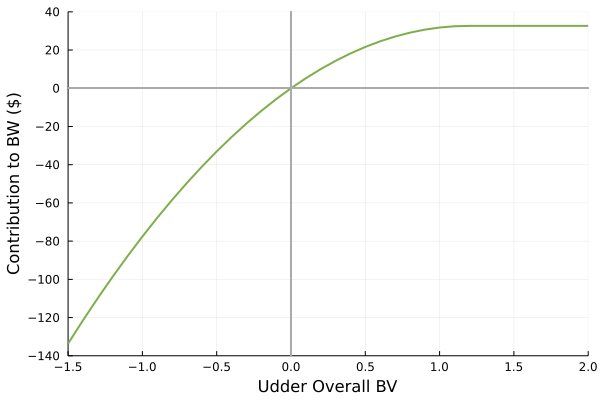
Note: for Udder Overall BV above 1.002, the dollar contribution to BW is fixed at $31.53
Some examples below:
| Udder BV | BW $ contribution from udder | Component A | Component B | A - B |
| -1.0 | -$94.351 | $62.942 x -1.0 = -$62.942 | $31.409 x -1.0 x -1.0 = $31.409 | -$62.942 - $31.409 = -$94.351 |
| -0.5 | -$39.323 | $62.942 x -0.5 = -$31.471 | $31.409 x -0.5 x -0.5 = $7.852 | -$31.471 - $7.852 = -$39.323 |
| 0.0 | $0.00 | $62.942 x 0 = $0 | $31.409 x 0 x 0 = $0 | $0 - $0 = $0 |
| +0.5 | $23.619 | $62.942 x +0.5 = $31.471 | $31.409 x +0.5 x +0.5 = $7.852 | $31.471 - $7.852 = $23.619 |
| +1.0 | $31.533 | $62.942 x +1.0 = $62.942 | $31.409 x +1.0 x +1.0 = $31.409 | $62.942 - $31.409 = $31.533 |
| +1.5 | $31.533 | +1.5 is greater than +1.002 so the BW $ contribution is fixed at $31.533 | ||
Economic values are calculated assuming industry averages for animal production, feed requirements, and farm systems. The following table is a list of the industry averages for the key performance traits which are incorporated into the EV calculations.
| Milk volume (L/cow) | 4,554 |
| Milk fat yield (kg/cow) | 218 |
| Milk protein yield (kg/cow) | 176 |
| Milksolids (kg/cow) | 394 |
| Milk fat (%) | 4.83 |
| Milk protein (%) | 3.89 |
| Liveweight (kg/cow) | 476 |
| Replacement rate (%) | 22 |
| Total metabolizable energy requirement per lactating cow (MJME/cow) | 62,713 |
| Total dry matter requirement per lactating cow (tDM/cow) | 5.45 |
If you have a specific query or have feedback to improve our online tools, we would love to hear from you. Please email: support.nzael@dairynz.co.nz and include:
You can also subscribe to NZAEL stakeholder email updates.