Forages for Reduced Nitrate Leaching, Brent and Maryn Austin (Canterbury)
Topics
11 min read
11 min read
Brent and Maryn, arable farmers from Mayfield, have actively contributed to FRNL's research, sharing knowledge and experiences to guide its direction. On their 552 ha farm, they mainly grow cereals and fodder crops. Their involvement with FRNL has led them to focus on the APSIM model's nitrogen fertiliser recommendations. You'll learn how crucial it is to trust these forecasts. Through computer modelling, they've understood nitrogen leaching effects, which led them to try different crop rotations. This page emphasises not leaving fields empty in autumn and winter, as it can increase nitrogen loss, impacting New Zealand's environmental image. Joining such programmes can enhance your farming methods by understanding nitrogen leaching better.
Brent and Maryn are arable farmers from Mayfield. They were part of a network of farmers in Canterbury who contributed to the direction of FRNL’s research, influenced priorities, shared experiences and provided a practical check to research.
Area:
552 ha
Dominant soils:
Templeton silt loam, Wakanui silt loam, Lismore stony silt loam
Dominant soils (sandy):
Eyre stony sandy loam
Average rainfall:
approx. 700 mm
Main crops:
cereals for grain harvest
Main crops (for stock grazing):
fodder crops; crop residues are grazed by sheep
Trading as:
Austin Farming Limited
“The programme looked interesting and very relevant to what is happening with current environmental issues.”
"We all have to do our part to keep New Zealand’s “clean green” image for future generations and I see this programme as an important part to reduce N leaching into our waters."
“We should be able to farm with more confidence in the future by having more knowledge about N leaching and how we can reduce or mitigate our leaching. Hopefully we should be able to improve our cropping rotations to produce more from the same inputs compared to what we are currently doing.”
Annual summary
The Simple Crop Resource Uptake Model operating within the Agricultural Production Systems sIMulator (SCRUM-APSIM) was used to simulate N balances at Brent and Maryn’s farm. APSIM predictions indicated that paddocks with high N leaching (≥30 kg N/ha) had greater residual soil N after the summer harvest.
Modelling outcomes of two seasons on the farm identified the following factors that increased the amount of leachable soil N:
Leaching was greater when at least two of these factors were in play. For example, excessive N application to spring-sown crops resulted in high residual soil N at risk of leaching if no crops were sown after the summer harvest to take up the N. Similarly, mineralised N from residues retained in paddocks was available for leaching if there was no vegetation in autumn/winter to take up water and N to reduce drainage and N leaching.
N leaching mitigation options that reduced N leaching and increased gross margins included:
When fertiliser N applications were modelled to match crop N demand (taking into account soil mineral N levels) without affecting yield and/or growing of catch crops, this resulted in a reduction in N leaching. These findings encouraged Brent to modify management in subsequent seasons. Demonstration paddock results supported the modelling of lower N fertiliser inputs and greater N use efficiency, and this translated into greater farm profitability and reduced N footprint.
Overall, results have shown that leaching is mainly influenced by rainfall through its impact on drainage, but farm management practices determine the amount of soil N at risk of leaching. Strategies that can reduce the amount of soil N available for leaching include: sowing catch crops immediately after the summer harvest to mop up residual soil N or N mineralised from soil organic matter and crop residues, and reduced N fertiliser use by calculating requirements with a recommendation system that accounts for soil mineralisation.
N leaching and drainage
The below table shows N leaching and drainage over five seasons (season = 01 Apr – 31 Mar) as estimated by SCRUM-APSIM at a depth of 150 cm.
| Paddock ID | Leaching (kg N/ha) | Drainage (mm) | ||||||||
| 2014-15 | 2015-16 | 2016-17 | 2017-18 | 2018-19 | 2014-15 | 2015-16 | 2016-17 | 2017-18 | 2018-19 | |
| Camb A | 45.8 | 22.1 | 8.6 | 13.5 | - | 271 | 167 | 144 | 351 | - |
| Camb B | 10.5 | 3.9 | 17.7 | 22.3 | - | 240 | 60 | 125 | 425 | - |
| Camb C | 53.5 | 9.2 | 22.7 | 32.2 | - | 316 | 97 | 260 | 442 | - |
| Camb D | 18.5 | 13.5 | 3.4 | 16.1 | - | 222 | 160 | 50 | 266 | - |
| Dane A | 16.3 | 14.3 | 0.4 | 20.9 | 9.4 | 177 | 156 | 21 | 317 | 160 |
| Dane B | 17.6 | 17.3 | 6.2 | 31.5 | 15.3 | 155 | 129 | 48 | 333 | 227 |
| Dane D1 | 6.8 | 1.9 | 2.9 | 22.4 | 16.7 | 305 | 90 | 56 | 292 | 148 |
| Dane D2 | 7.4 | 1.9 | 3.0 | 28.3 | 11.4 | 305 | 77 | 52 | 335 | 124 |
| Dane E | 23.6 | 7.0 | 0.2 | 27.9 | 5.9 | 197 | 44 | 2 | 264 | 273 |
| Dane G | 19.1 | 4.4 | 3.0 | 24.1 | 13.7 | 270 | 99 | 45 | 357 | 307 |
| Dane JK | 13.5 | 3.4 | 0.0 | 16.5 | 24.0 | 255 | 70 | 0 | 328 | 224 |
| Dane ST | 19.4 | 13.2 | 6.3 | 10.8 | 9.2 | 221 | 135 | 48 | 328 | 151 |
| Dane W | 38.2 | 19.1 | 24.9 | 29.6 | 4.5 | 226 | 91 | 110 | 355 | 127 |
| Dane X1 | 57.2 | 1.8 | 0.7 | 5.6 | 10.8 | 565 | 66 | 22 | 296 | 313 |
| Dane X2 | 14.6 | 2.5 | 0.6 | 4.9 | 14.2 | 324 | 78 | 17 | 410 | 306 |
| Dane Y1 | 19.6 | 3.9 | 1.5 | 4.4 | 7.7 | 256 | 80 | 31 | 409 | 246 |
| Dane Y2 | 22.2 | 8.2 | 0.8 | 13.2 | 15.4 | 216 | 74 | 7 | 282 | 219 |
| Tav A | 38.5 | 7.9 | 15.0 | 11.6 | 8.6 | 326 | 139 | 160 | 393 | 322 |
| Tav A2 | 7.7 | 3.0 | 13.5 | 11.4 | 10.0 | 196 | 125 | 165 | 405 | 435 |
| Tav AB | - | - | - | - | 10.1 | - | - | - | - | 265 |
| Tav B | 6.4 | 1.7 | 0.0 | 24.3 | 15.1 | 246 | 133 | 0 | 292 | 235 |
| Tav B2 | 5.4 | 6.3 | 13.8 | 9.1 | 5.9 | 371 | 348 | 234 | 259 | 135 |
| Tav C | 19.2 | 1.3 | 0.1 | 5.8 | 3.6 | 246 | 45 | 8 | 242 | 126 |
| Tav CD | - | - | - | - | 4.3 | - | - | - | - | 134 |
| Tav D | 6.1 | 1.2 | 2.0 | 14.0 | 13.9 | 232 | 71 | 236 | 327 | 123 |
| Tav D2 | 6.1 | 2.7 | 1.1 | 32.3 | 16.3 | 232 | 146 | 30 | 293 | 162 |
| Tav E | 4.2 | 2.7 | 7.7 | 12.5 | 11.6 | 129 | 89 | 289 | 385 | 206 |
| Tav E2 | 4.2 | 2.7 | 7.0 | 19.3 | 13.1 | 129 | 89 | 306 | 305 | 225 |
| Tav F | 6.6 | 1.2 | 3.1 | 13.4 | 11.3 | 336 | 85 | 76 | 438 | 254 |
| Tav G | 20.5 | 5.0 | 8.4 | 19.3 | 8.4 | 212 | 53 | 94 | 369 | 159 |
| Tav H | 25.3 | 19.3 | 33.9 | 17.3 | 19.7 | 205 | 70 | 223 | 404 | 284 |
| Tav J | 29.1 | 29.9 | 14.2 | 29.1 | 8.8 | 188 | 121 | 146 | 418 | 147 |
| Tav K | 15.0 | 10.7 | 14.9 | 13.3 | 10.7 | 176 | 107 | 124 | 318 | 156 |
| Whole-farm average | 20.2 | 8.5 | 8.0 | 17.9 | 11.3 | 247 | 105 | 101 | 347 | 209 |
Fertiliser N applied and N uptake
The below table shows fertiliser application and N uptake (as estimated by SCRUM-APSIM) over five seasons (season = 01 Apr – 31 Mar).
| Paddock | Applied fertiliser (kg N/ha) | N uptake (kg N/ha) | ||||||||
| 2014-15 | 2015-16 | 2016-17 | 2017-18 | 2018-19 | 2014-15 | 2015-16 | 2016-17 | 2017-18 | 2018-19 | |
| Camb A | 183 | 183 | 95 | 236 | - | 249 | 265 | 145 | 232 | - |
| Camb B | 229 | 30 | 83 | 182 | - | 176 | 122 | 262 | 161 | - |
| Camb C | 146 | 194 | 166 | 231 | - | 218 | 296 | 205 | 289 | - |
| Camb D | 183 | 204 | 89 | 70 | - | 266 | 190 | 131 | 81 | - |
| Dane A | 196 | 183 | 164 | 246 | 274 | 247 | 194 | 140 | 347 | 241 |
| Dane B | 181. | 204 | 124 | 276 | 230 | 224 | 191 | 211 | 262 | 218 |
| Dane D1 | 229 | 201 | 150 | 230 | 105 | 231 | 270 | 227 | 178 | 223 |
| Dane D2 | 229 | 201 | 143 | 115 | 151 | 225 | 280 | 250 | 113 | 202 |
| Dane E | 229 | 133 | 176 | 68 | 83 | 242 | 206 | 225 | 132 | 137 |
| Dane G | 104 | 201 | 210 | 303 | 388 | 96 | 280 | 230 | 427 | 258 |
| Dane JK | 229 | 183 | 92 | 253 | 184 | 204 | 258 | 231 | 258 | 199 |
| Dane ST | 181 | 194 | 30 | 21 | 162 | 191 | 210 | 119 | 75 | 291 |
| Dane W | 229 | 201 | 114 | 159 | 158 | 232 | 252 | 178 | 254 | 232 |
| Dane X1 | 100 | 114 | 184 | 184 | 227 | 114 | 193 | 184 | 232 | 268 |
| Dane X2 | 196 | 198 | 135 | 184 | 227 | 178 | 116 | 289 | 192 | 284 |
| Dane Y1 | 247 | 23 | 120 | 197 | 205 | 276 | 70 | 255 | 174 | 201 |
| Dane Y2 | 247 | 275 | 99 | 230 | 23 | 101 | 314 | 340 | 239 | 119 |
| Tav A | 167 | 240 | 152 | 184 | 0 | 192 | 252 | 181 | 165 | 36 |
| Tav A2 | 167 | 240 | 152 | 147 | - | 195 | 259 | 196 | 234 | - |
| Tav AB | - | - | - | - | 243 | - | - | - | - | 219 |
| Tav B | 167 | 215 | 47 | 170 | 231 | 153 | 265 | 68 | 269 | 199 |
| Tav B2 | 167 | 229 | 92 | 101 | 231 | 148 | 315 | 131 | 218 | 215 |
| Tav C | 137 | 158 | 89 | 23 | 297 | 110 | 185 | 171 | 125 | 302 |
| Tav CD | - | - | - | - | 92 | - | - | - | - | 198 |
| Tav D | 167 | 206 | 229 | 66 | 21 | 175 | 140 | 352 | 235 | 152 |
| Tav D2 | 167 | 200 | 184 | 205 | 44 | 186 | 255 | 251 | 231 | 259 |
| Tav E | 220 | 161 | 184 | 235 | 205 | 283 | 164 | 278 | 241 | 232 |
| Tav E2 | 220 | 161 | 92 | 0 | 205 | 318 | 171 | 209 | 275 | 232 |
| Tav F | 181 | 193 | 30 | 138 | 231 | 160 | 174 | 265 | 145 | 274 |
| Tav G | 90 | 182 | 257 | 218 | 134 | 150 | 190 | 302 | 315 | 245 |
| Tav H | 196 | 137 | 0 | 293 | 251 | 198 | 197 | 36 | 304 | 255 |
| Tav J | 134 | 194 | 143 | 0 | 205 | 128 | 325 | 157 | 106 | 289 |
| Tav K | 0.0 | 201 | 152 | 134 | 257 | 34 | 321 | 163 | 194 | 380 |
| Whole-farm average | 178 | 165 | 124 | 166 | 185 | 181 | 206 | 193 | 196 | 227 |
2017 – oats and faba beans as catch crops
Crops sown in autumn, following summer cropping, or sown in winter, following grazing of forage crops, can be very useful in mopping up residual mineral N from the soil and therefore reducing the risk of N leaching during winter and spring. The key to maximising the benefit is to plant a catch crop as early as practical and to select a winter-active species.
A grazed fodder beet paddock had oats and faba beans sown as catch crops on 26 May 2017 and these were compared to a fallow in an unreplicated demonstration. The cover crops were in the ground for three months, with dry matter cuts taken on 7 September 2017 prior to the sowing of a spring barley. Due to the wet winter conditions the catch crops were slow to establish. Even though overall yields were low, soil mineral N levels in September were higher in the fallow and indicated that around 25 kg/ha of N was mineralised (see below table). Changes in mineral N for the two catch crop treatments are a net result of N mineralisation (increasing mineral N), crop N uptake and immobilisation of N during the decomposition of the residual fodder beet. These numbers suggest that there was greater immobilisation in the presence of catch crops, despite the low yields.
Catch crop yields (t/ha), N uptake (kg N/ha), baseline and harvest profile soil mineral N (kg/ha); soil sampling dates 30/5/17 and 7/9/17 respectively.
| Paddock | Pervious crop | Catch Crop sown | Baseline profile soil mineral N (kg/ha) | Harvest profile soil mineral N (kg/ha) | Catch crop yield (t/ha) | Catch crop N uptake (kg/ha) |
| TAV B | Grazed fodder beet | Faba beans | 66.2 | 51.3 | 0.34 | 17.12 |
| TAV B | Grazed fodder beet | Oats | 60.9 | 42.2 | 0.06 | 4.83 |
| TAV B | Grazed fodder beet | Fallow | 39.7 | 63.1 | - | - |
2018 – autumn barley vs fallow then spring barley
Autumn sown barley was compared to leaving the paddock fallow (i.e. prior to sowing spring barley) to see how much N the autumn sown barley takes up prior to fertiliser being applied. Barley (Tavern) was sown 10 May 2018.
Autumn sown barley was shown to utilise N which would otherwise be at risk of leaching, compared with fallow and spring sown barley. Autumn barley also has the potential to decrease spring N leaching losses as it will be well established compared to an August or September sown crop and able to take up more N.
Note: Brent’s experience of sowing barley earlier, instead of having a winter fallow, is that this can be risky as there are no true winter barleys and if it does not get established well due to unfavourable establishment conditions the spring sown crops will yield better.
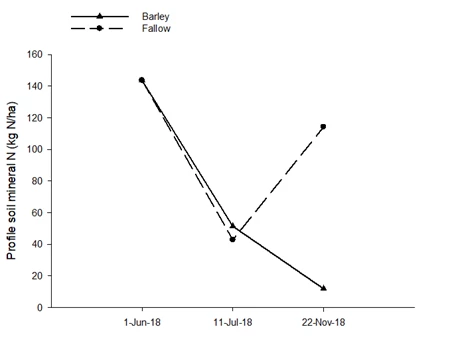
Baseline (1 June 18), 11 July and 22 November soil mineral N (kg/ha) from the fallow and autumn sown barley (0-60 cm).
An article relating to the SCRUM-APSIM modelling work was published in Agronomy NZ.
A full report on the arable monitor farms, including the detailed results of the catch crop demonstrations on this farm and at Chertsey, and an N fertiliser rate demonstration on another arable monitor farm.
Now’s the perfect time to check in, plan, and set up for a strong season. We’ve pulled together smart tips and tools to help you stay ahead all winter long.
Whether you prefer to read, listen, or download handy guides, we’ve got you covered with trusted tools to support your journey every step of the way.


