Workplace productivity case study
Topics
6 min read

Ten dairy farms from the Waikato/BOP and Canterbury/West Coast regions were involved in this study throughout the 2024/25 season. The study explored how different approaches, including technology use, reduced milking frequency, and people management practices can impact workplace productivity and attractiveness, and farm performance.
By comparing key farm system measures and the time spent on everyday tasks at five points across the season, the study aimed to better understand what drives efficiency on farm and how many labour hours are needed during key times of the year and how these are used over different tasks.
Tasks were recorded in 35 task sub-codes and summarised in 7 key categories.

Milking (herding, cleaning up)

Animal care (calf rearing, animal treatments, heat detection)

Feed (Pasture management, feeding out, cropping)

Farm & equipment (irrigation, effluent, R&M)

Office tasks (payroll, accounts, planning)

People tasks (breaks, meetings, training)

Off farm tasks (runoff work, town trips)
The data captures each farmer’s best estimate of how much time the farm team spent on key tasks across 2–3 typical days in a week, including days with different workloads such as weekdays and weekends. It also includes the total hours spent on these tasks across the full week. Together, this provides a snapshot of how work was being done on each farm at five different points throughout the season.
There were large differences between farms in some task areas, however each farm and farm system is different, and each business has different goals, ideas and pathways to achieving what they want. When measuring workplace productivity on your own farm, it is important to consider what and where you NEED to spend time vs. what and where you WANT to spend time.
Findings from the study showed hours worked at different times throughout the year varied significantly from farm-to-farm:
As herd size increases, total hours worked each week generally increase too. To make comparisons fair across farms of different sizes, this study uses hours worked per week per 100 cows. This helps remove the effect of herd size and gives a clearer picture of how workload changes across the season. The graphs below shows how workload tracked across the season for each of the 10 farms.

Reducing milking frequency is one of the most powerful ways to improve labour efficiency. The study identified that farms that optimise milking schedules create more flexibility.
Example: Farm 2
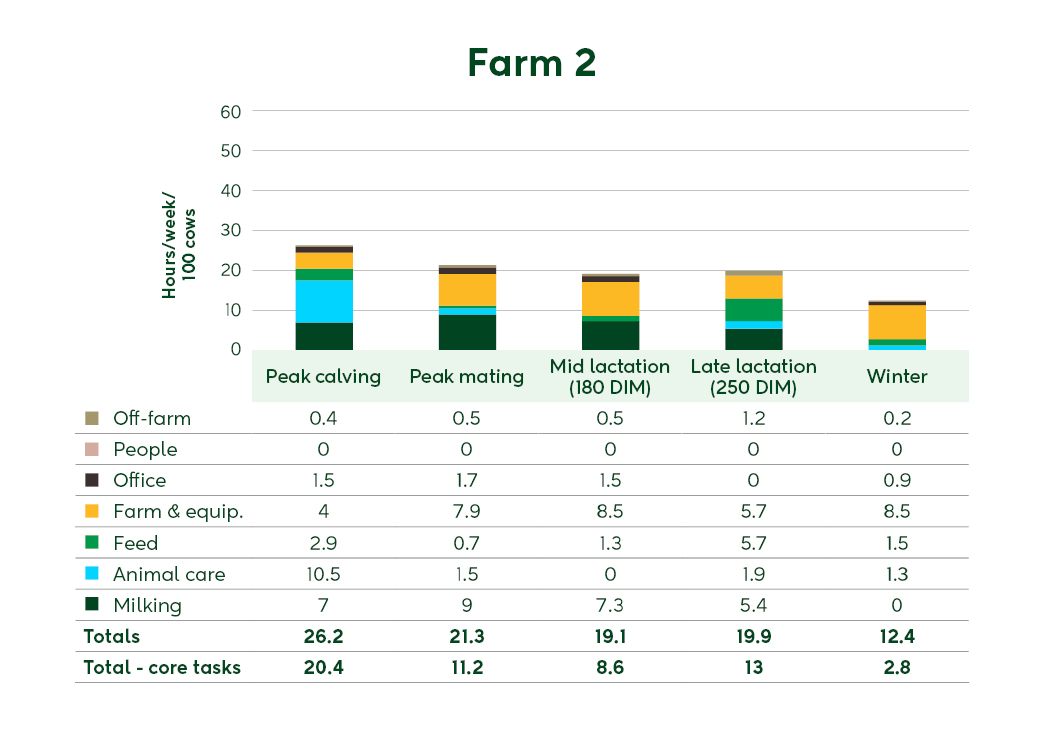
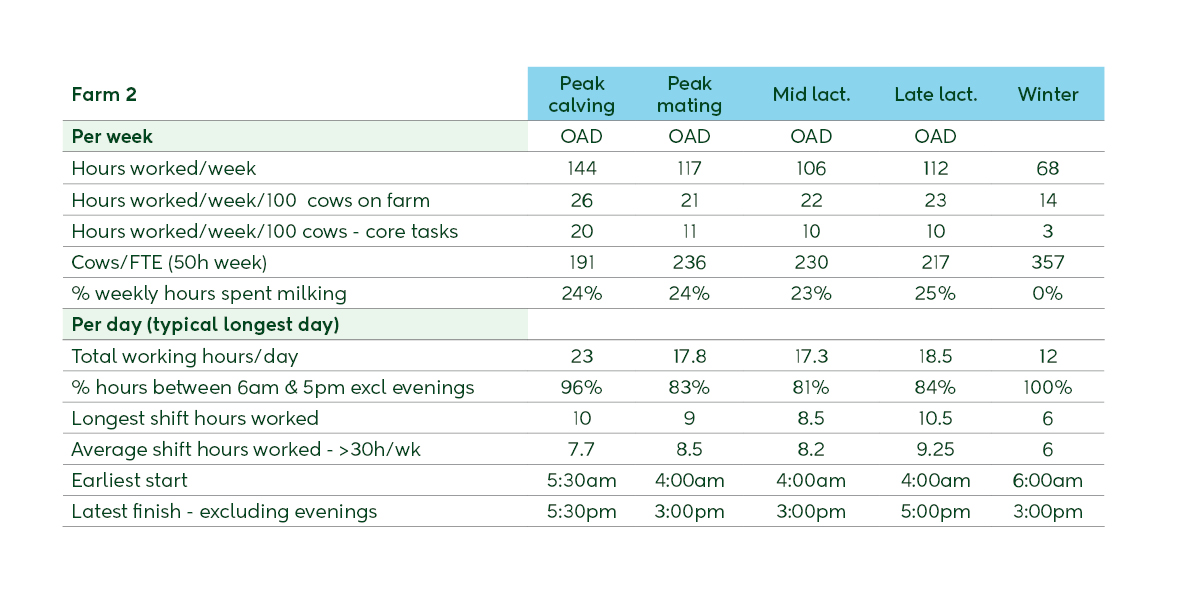
Milking once-a-day all season with only two farm staff for 550 cows. This farm had significantly lower hours worked per 100 cows than other farms in the Waikato/BOP area. An advantage of this approach is having the option to improve work-life balance or allowing time to focus on higher-value farm tasks. Small changes in milking routine can have large impacts on daily workload.
This study highlighted that well-designed infrastructure, such as low-labour dairies, efficient effluent systems, and smart technology (e.g. auto-drafting, cup removers, wearables, virtual fencing), significantly reduces routine workload.
Example: Farm 4
Utilising Halter technology helped increase pasture allocation options on steep hills as well as reducing the time and effort required for grazing management, made it easier and saved time managing multiple mobs, as well as time during mating. A limitation was poor infrastructure at the dairy which reduced labour efficiency on a daily task, whereas other farms with good infrastructure, built efficiency into their system every day.
Clear leadership, defined roles, good communication, and the right labour strategy determine whether staff time is used well. This study found that preventative animal health, smart use of automation, and strong workplace culture all influence how effectively teams spend their time.
Example: Farm 8
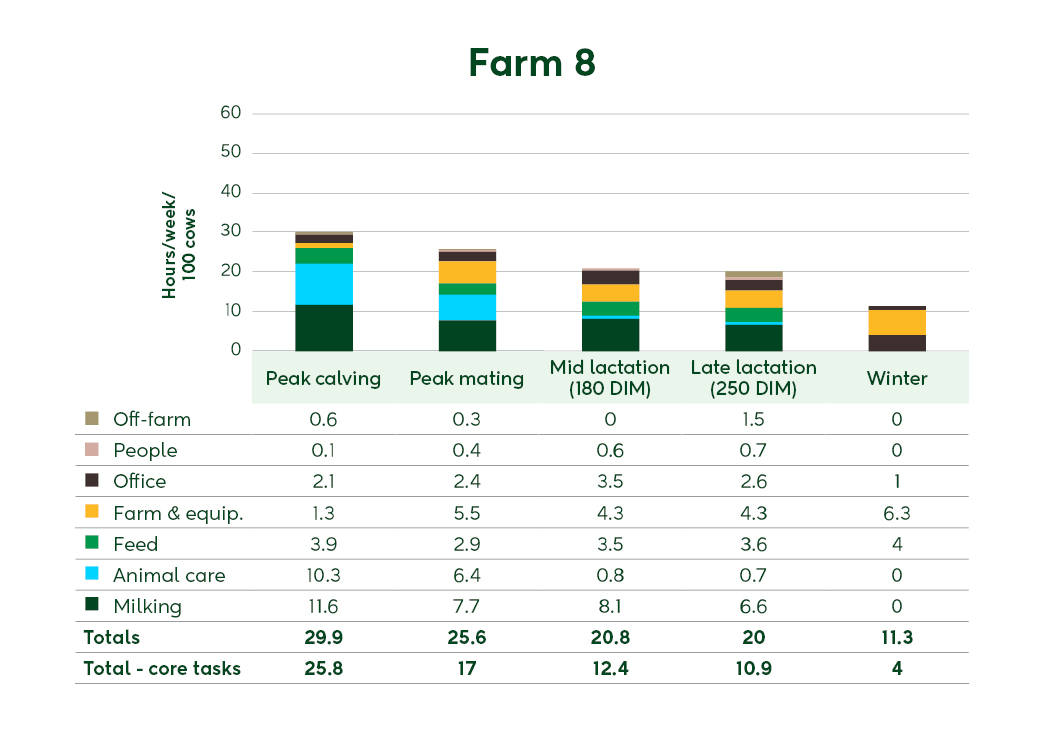
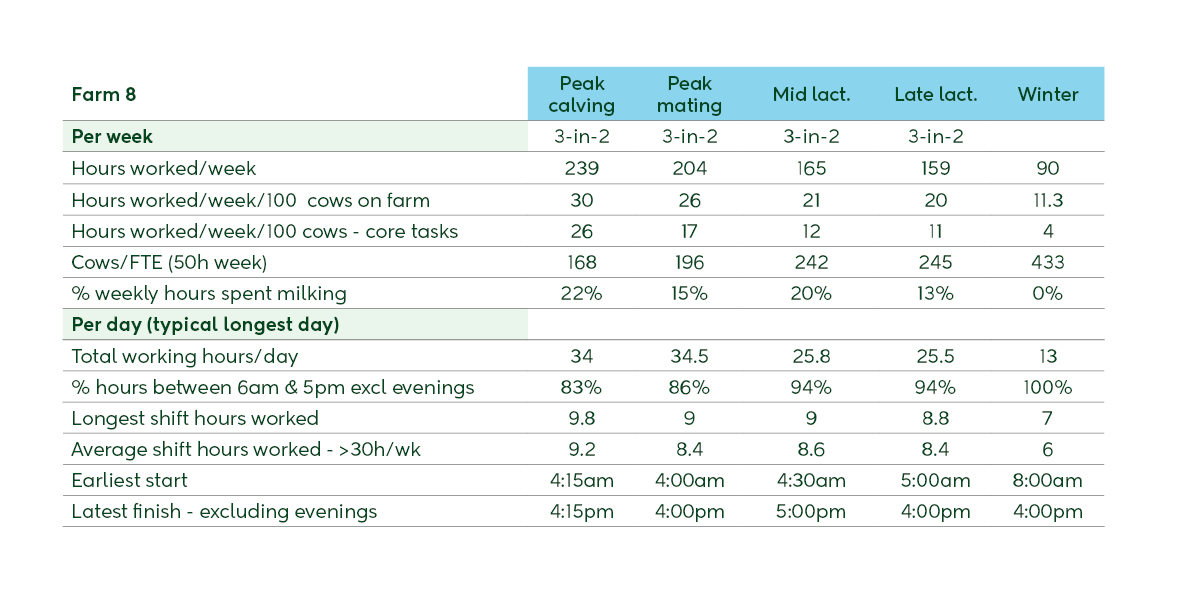
Striving to achieve a healthy workplace culture by adopting a “Home by 5pm” mentality. Farm staff were on either a 6-2 or 5-2 roster and worked alongside the equity manager to try and achieve all farm tasks by 5pm. This was supported by a 3-in-2 milking frequency all season and daily coffee catch ups for the entire team. The results for Farm 8 support this being an effective approach for this farm.
Farmers in the study noted that working efficiently is important, but it’s not all about working the least hours on tasks, it’s about achieving good outcomes and meeting goals of the farm and the team. For example, farmers have different practices around calf rearing and colostrum cow management.
At peak calving, milking and animal care account for most hours and can vary significantly between farms. The graph below shows a breakdown of typical hours worked/week per 100 cows for the 7 task categories at peak calving.

Some farm teams spent a greater share of their time on core farm tasks such as milking, animal care and feeding, while spending less time on activities like repairs and maintenance or managing off-farm areas such as run-offs. This difference was most noticeable later in the season. To make it easier to compare farms and seasonal changes, core task hours are shown as hours worked per week per 100 cows.
Calving often requires the most hours of work per day, but the big difference between farms is where the time goes and how efficiently it’s used. Across these farms:
The large spread means a variety of factors influence workload and efficiency, not just cow numbers. The number of cows in milk and particularly how many in the colostrum mob at the time of recording influences milking efficiency, as did the milking and calf rearing practices.
The study found these areas added time pressure during calving:
Ways you might improve efficiency on your farm:
Workplace productivity varied widely across the farms in this study. Farms milking once a day (OAD) generally required fewer hours per 100 cows, with some as low as 26 hours, compared with farms milking twice a day (TAD), which ranged up to 55 hours. This highlights the impact milking frequency can have on overall workload.
Even with this variation, milking made up a relatively small share of total labour during peak calving (between 13% and 33%) across the farms. This shows that during this period, much of the workload is driven by calving-related jobs rather than time spent in the shed.
The table below compares milking labour requirements and productivity across 10 farm systems at peak calving and mid-lactation (180 DIM). It highlights how milking frequency and system design influence labour efficiency, with the time spent milking each week varying between systems and stages of lactation.

This table shows how milking frequency influences labour demand, working hours, and the proportion of time spent milking during peak calving across 10 farm systems. Longest individual shifts at peak calving reached 11.5 hours worked (not including breaks). The data shows that individual preferences determine workplace characteristics, particularly around starts and finish times.

Find out how the hours change across the season for each individual farm below:
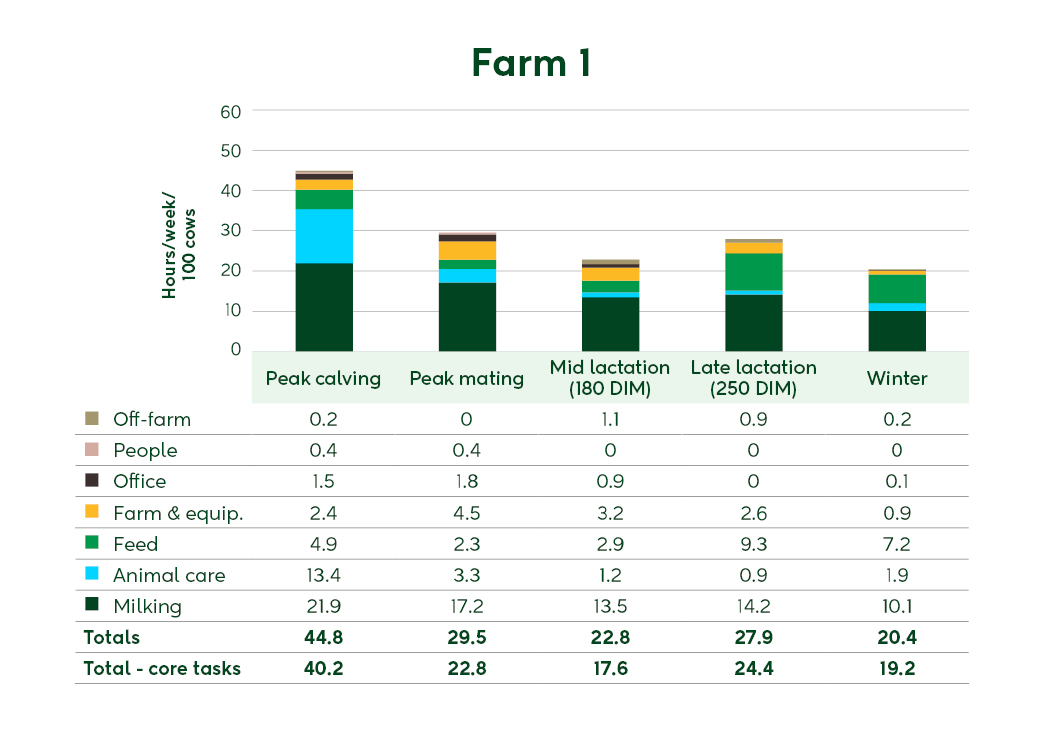
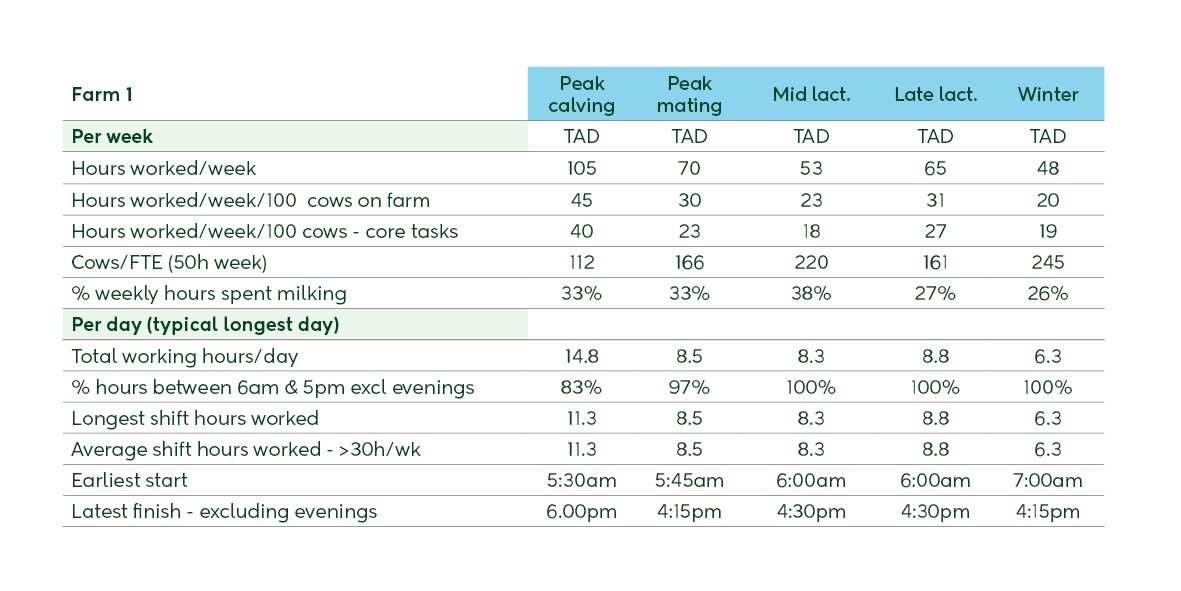
Farm 1: Waikato/BoP | 235 cows | TAD
1-person team, extended lactation, 235 cows/FTE
Factors improving workplace productivity and attractiveness
Technology and infrastructure
Business structure
Sharemilker contract may influence fewer hours on farm maintenance, as indicated in the data.
Limitations or potential improvements
Farmer suggests an auto plant wash would save time daily, particularly now that they are milking all year round.
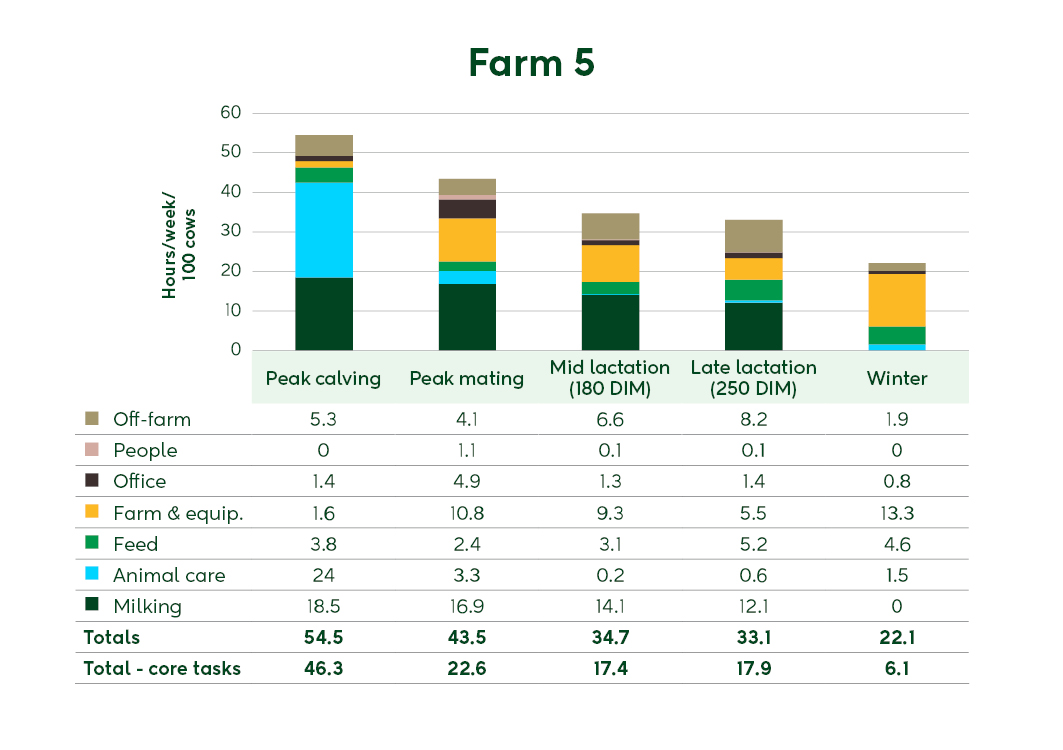
Hours per week per 100 cows by task
Farm 2: Waikato/BoP | 550 cows | OAD
Factors improving workplace productivity and attractiveness
Technology and infrastructure
Business structure
Sharemilker contract may influence fewer hours on farm maintenance, as indicated in the data.
Limitations or potential improvements
Farmer suggests an auto plant wash would save time daily, particularly now that they are milking all year round.
Hours per week per 100 cows by task
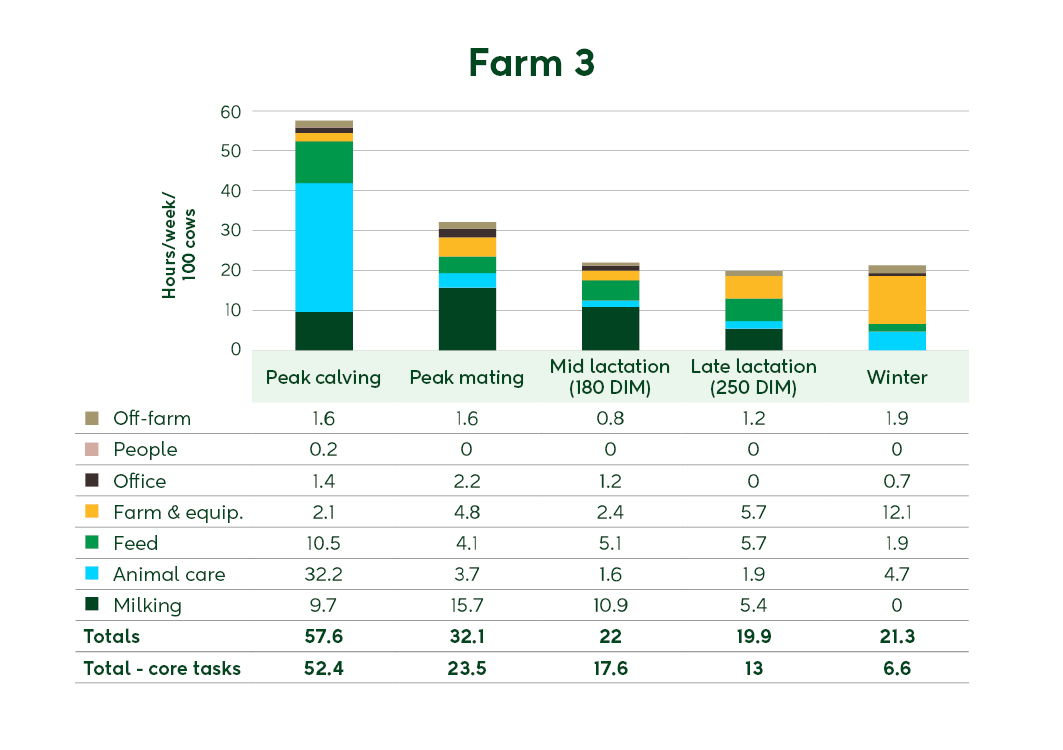
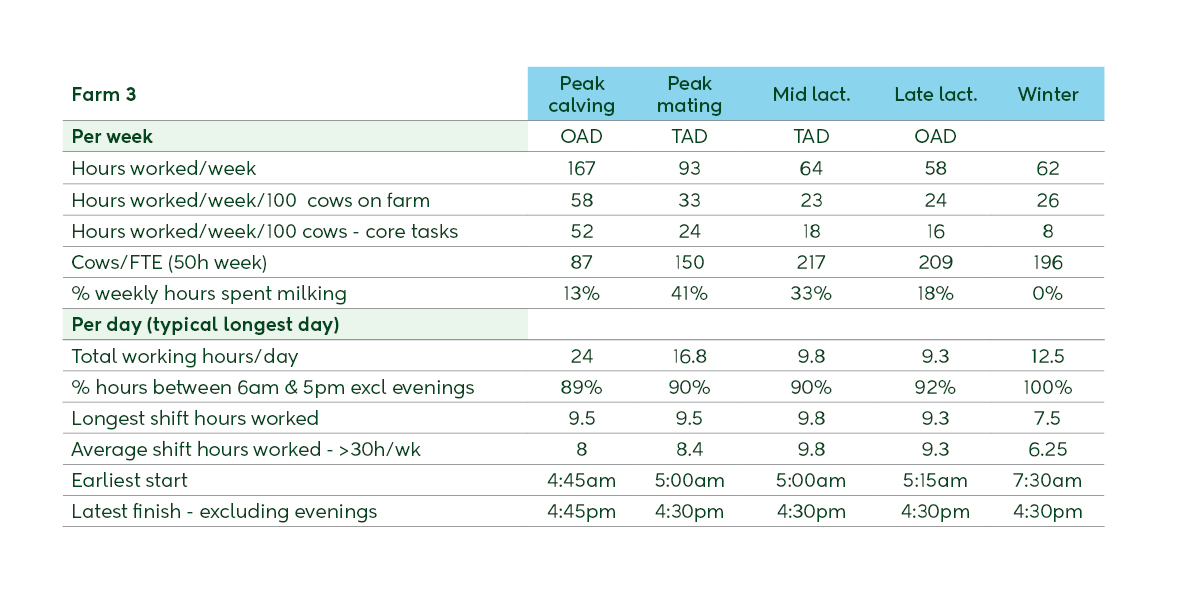
Farm 3: Waikato/BoP | 290 cows | TAD
1-person team, extended lactation, 235 cows/FTE
Factors improving workplace productivity and attractiveness
Technology and infrastructure
Business structure
Sharemilker contract may influence fewer hours on farm maintenance, as indicated in the data.
Limitations or potential improvements
Farmer suggests an auto plant wash would save time daily, particularly now that they are milking all year round.
Hours per week per 100 cows by task
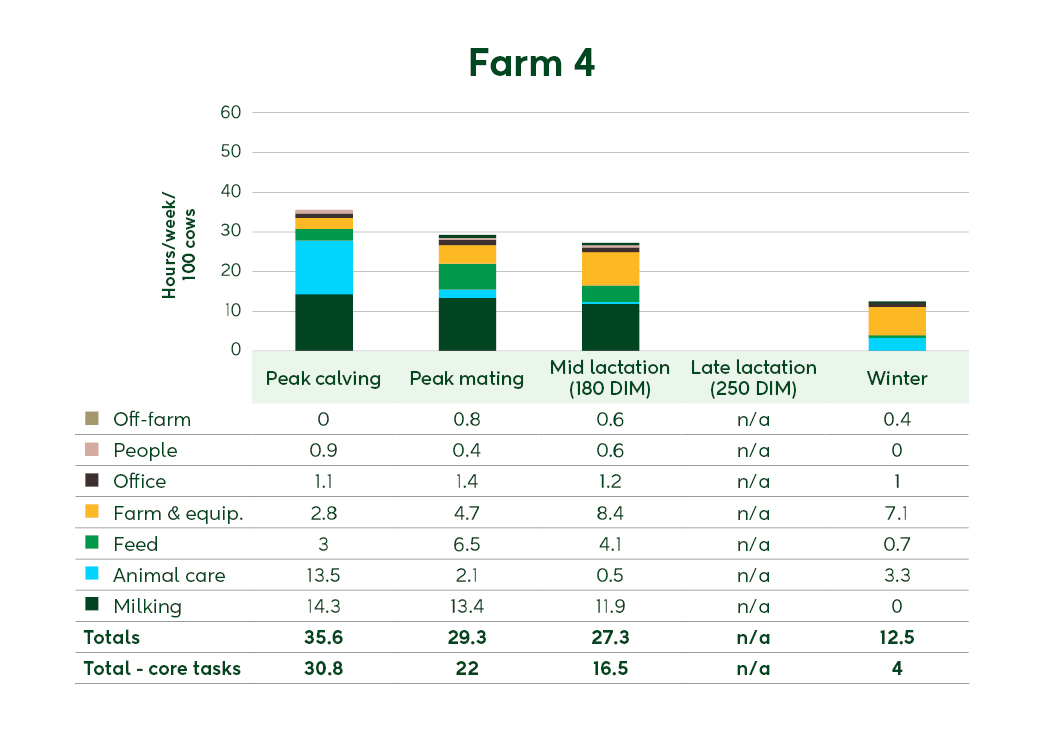
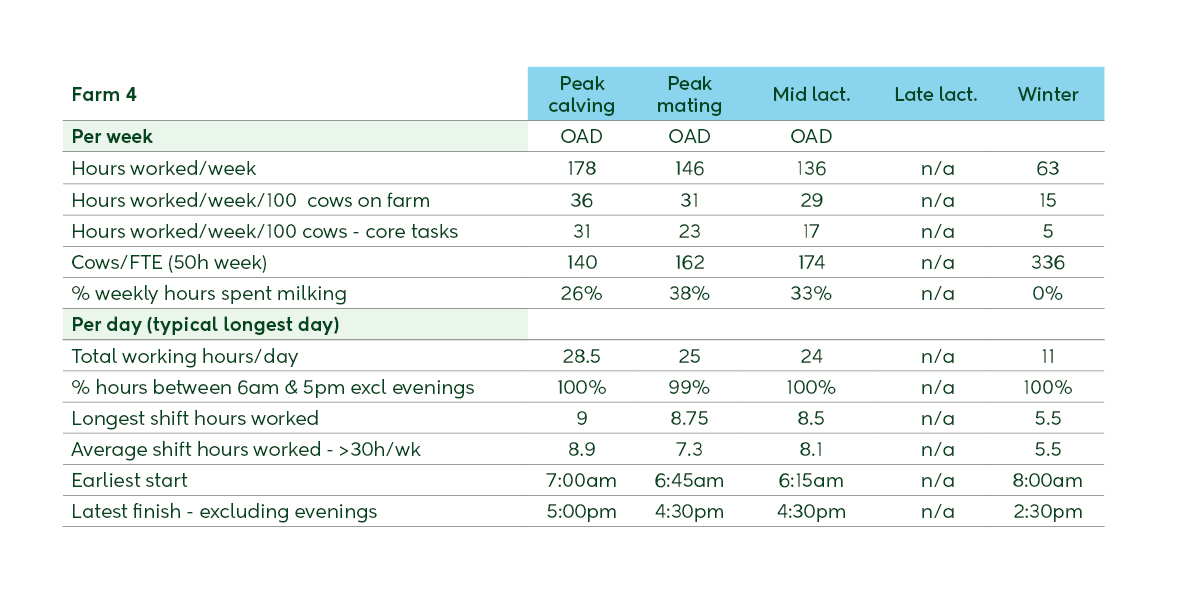
Farm 4: Waikato/BoP | 500 cows | OAD
1-person team, extended lactation, 235 cows/FTE
Factors improving workplace productivity and attractiveness
Technology and infrastructure
Business structure
Sharemilker contract may influence fewer hours on farm maintenance, as indicated in the data.
Limitations or potential improvements
Farmer suggests an auto plant wash would save time daily, particularly now that they are milking all year round.
Hours per week per 100 cows by task
Farm 5: Waikato/BoP | 475 cows | OAD
1-person team, extended lactation, 235 cows/FTE
Factors improving workplace productivity and attractiveness
Technology and infrastructure
Business structure
Sharemilker contract may influence fewer hours on farm maintenance, as indicated in the data.
Limitations or potential improvements
Farmer suggests an auto plant wash would save time daily, particularly now that they are milking all year round.
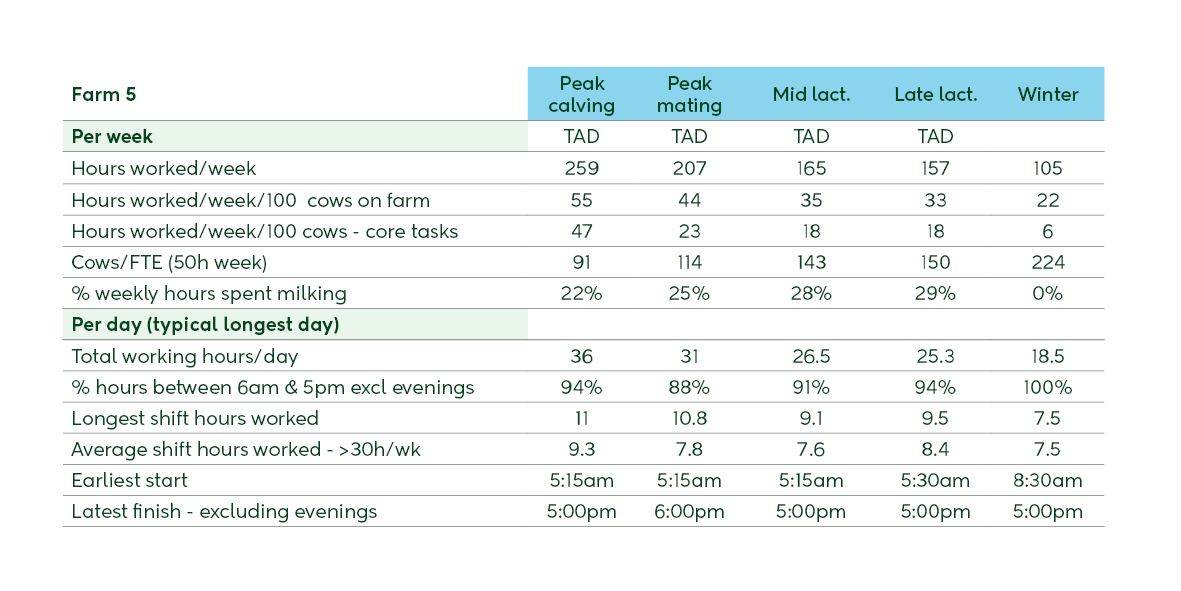
Hours per week per 100 cows by task
Farm 6: Canterbury | 600 cows | 10-in-7
1-person team, extended lactation, 235 cows/FTE
Factors improving workplace productivity and attractiveness
Technology and infrastructure
Business structure
Sharemilker contract may influence fewer hours on farm maintenance, as indicated in the data.
Limitations or potential improvements
Farmer suggests an auto plant wash would save time daily, particularly now that they are milking all year round.
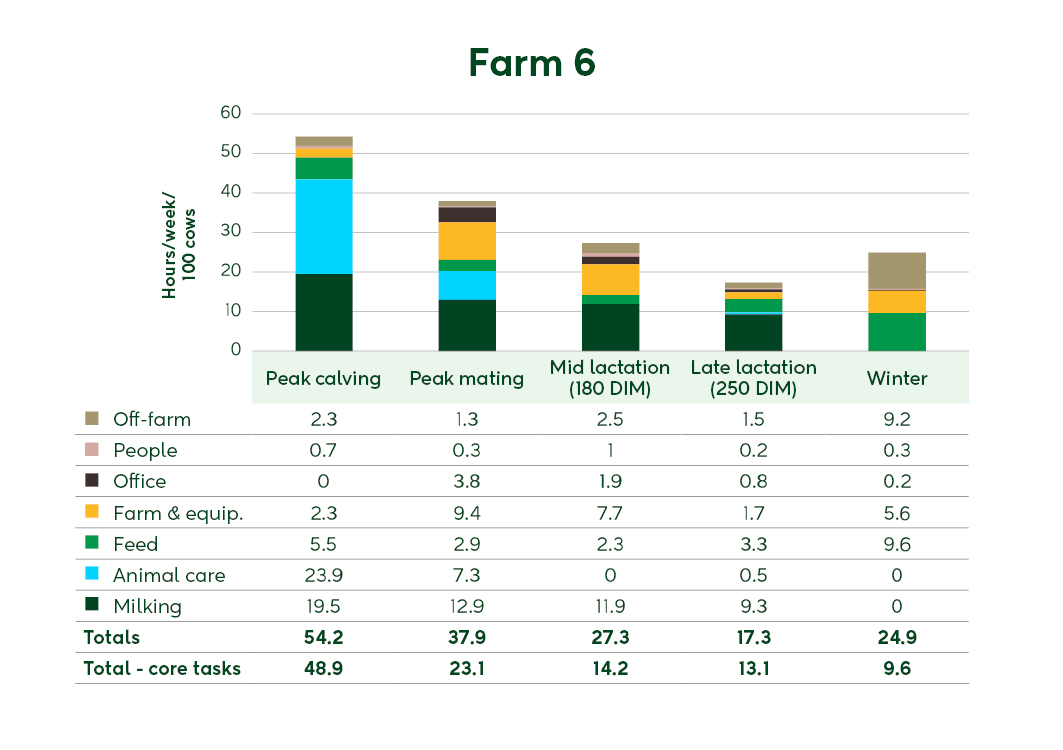
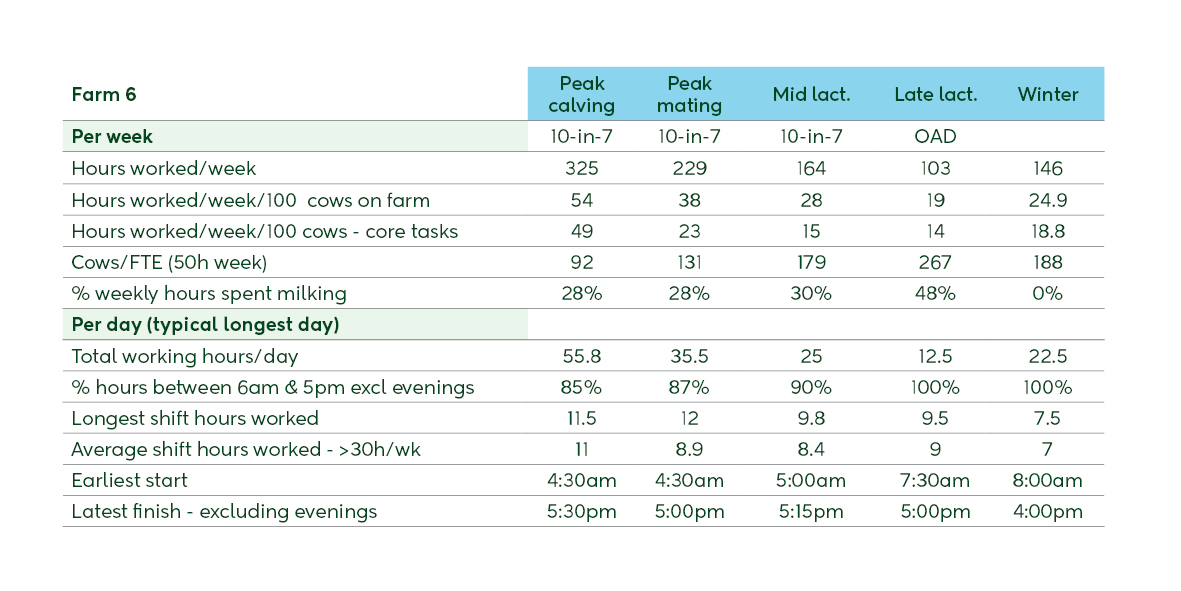
Hours per week per 100 cows by task
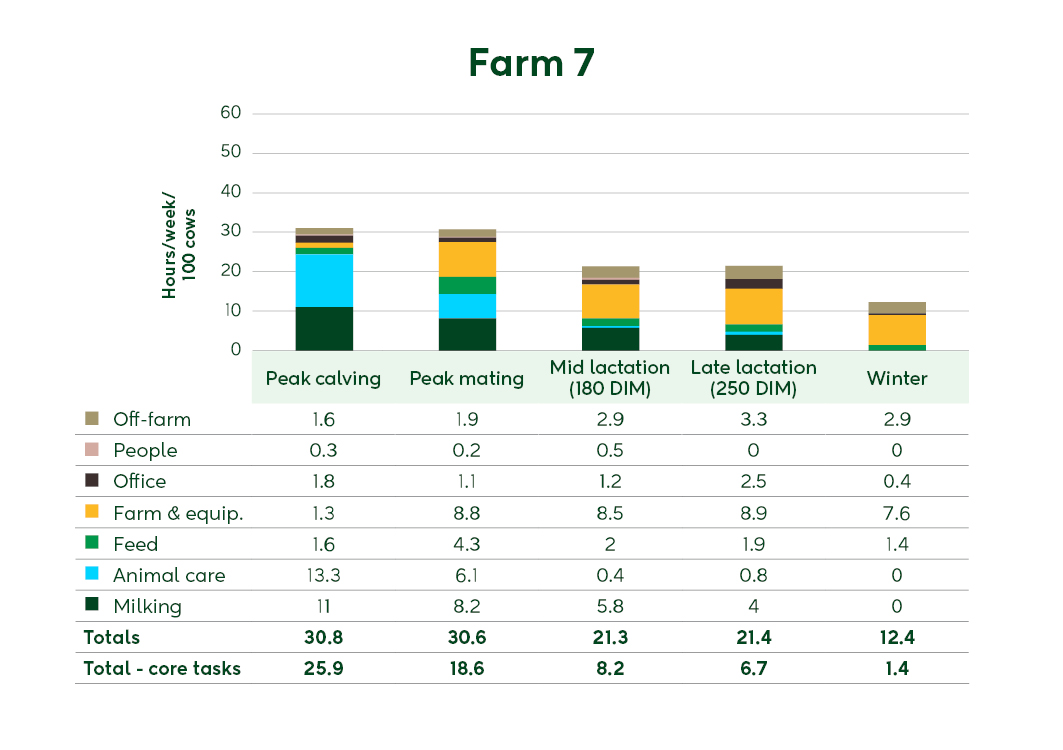
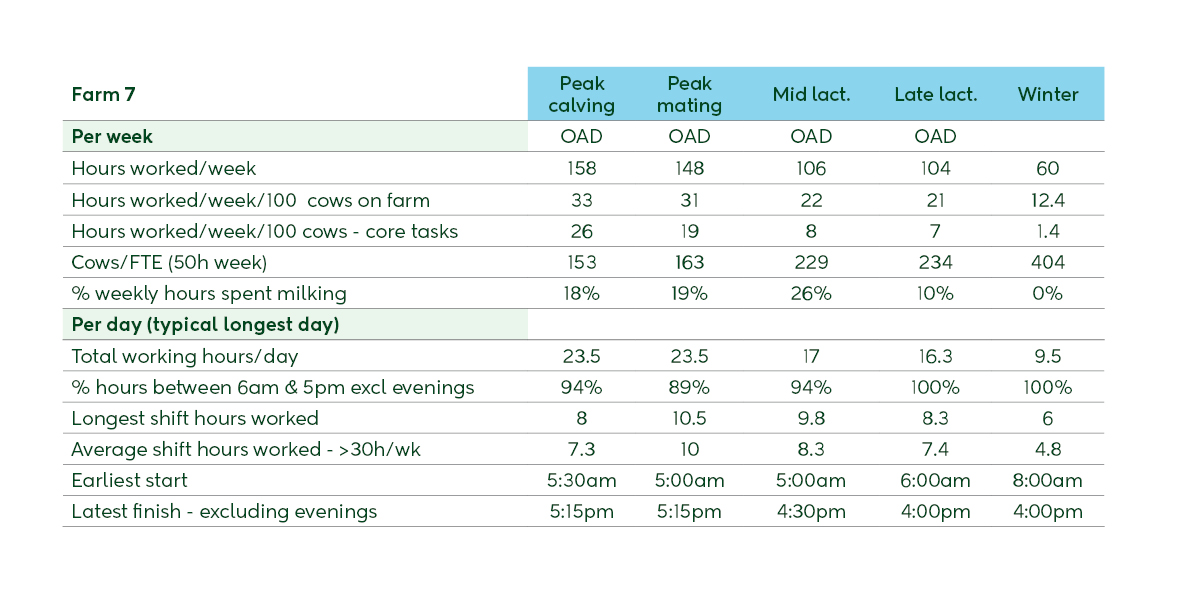
Farm 7: West Coast | 485 cows | OAD
1-person team, extended lactation, 235 cows/FTE
Factors improving workplace productivity and attractiveness
Technology and infrastructure
Business structure
Sharemilker contract may influence fewer hours on farm maintenance, as indicated in the data.
Limitations or potential improvements
Farmer suggests an auto plant wash would save time daily, particularly now that they are milking all year round.
Hours per week per 100 cows by task
Farm 8: Canterbury | 800 cows | 3-in-2
1-person team, extended lactation, 235 cows/FTE
Factors improving workplace productivity and attractiveness
Technology and infrastructure
Business structure
Sharemilker contract may influence fewer hours on farm maintenance, as indicated in the data.
Limitations or potential improvements
Farmer suggests an auto plant wash would save time daily, particularly now that they are milking all year round.
Hours per week per 100 cows by task
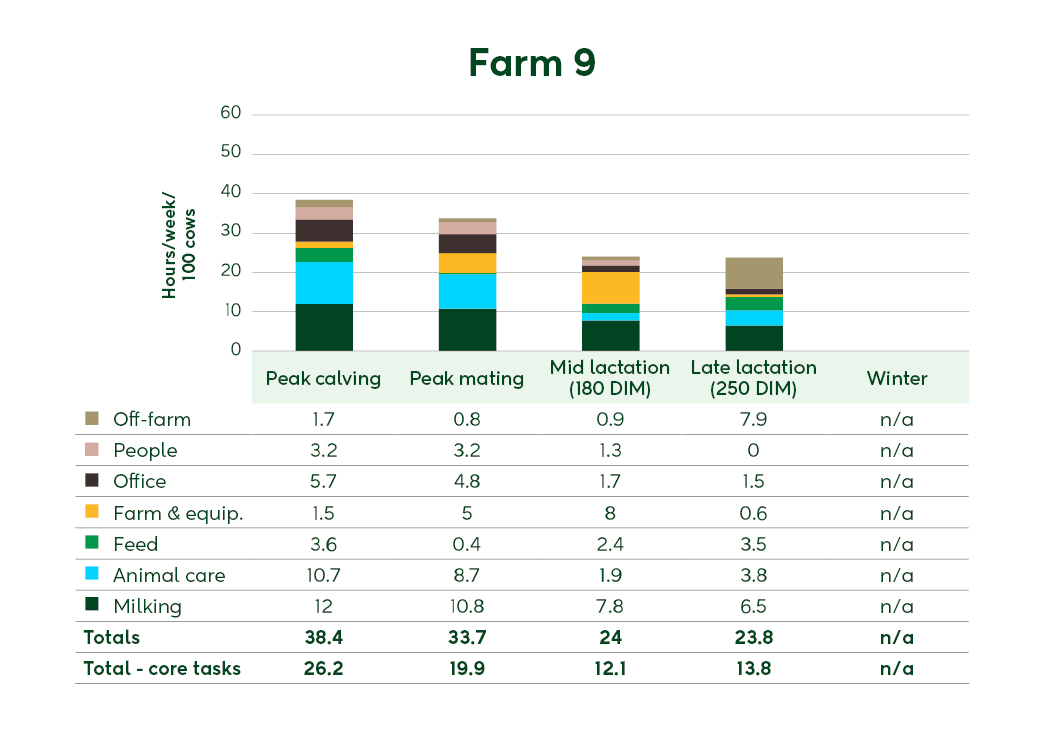
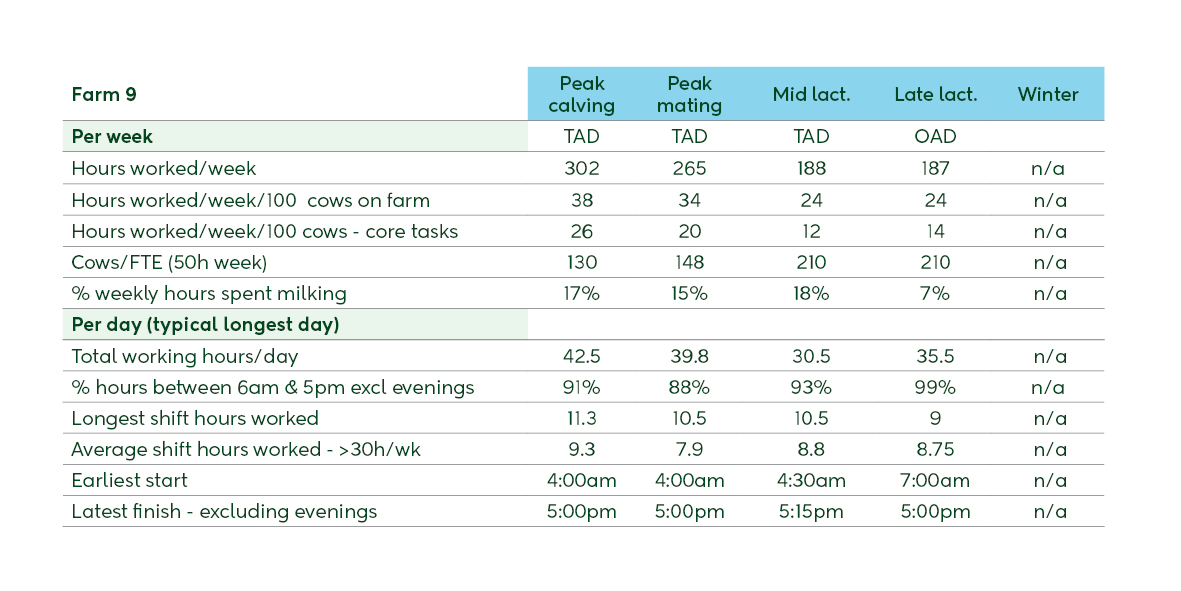
Farm 9: Canterbury | 787 cows | TAD
1-person team, extended lactation, 235 cows/FTE
Factors improving workplace productivity and attractiveness
Technology and infrastructure
Business structure
Sharemilker contract may influence fewer hours on farm maintenance, as indicated in the data.
Limitations or potential improvements
Farmer suggests an auto plant wash would save time daily, particularly now that they are milking all year round.
Hours per week per 100 cows by task
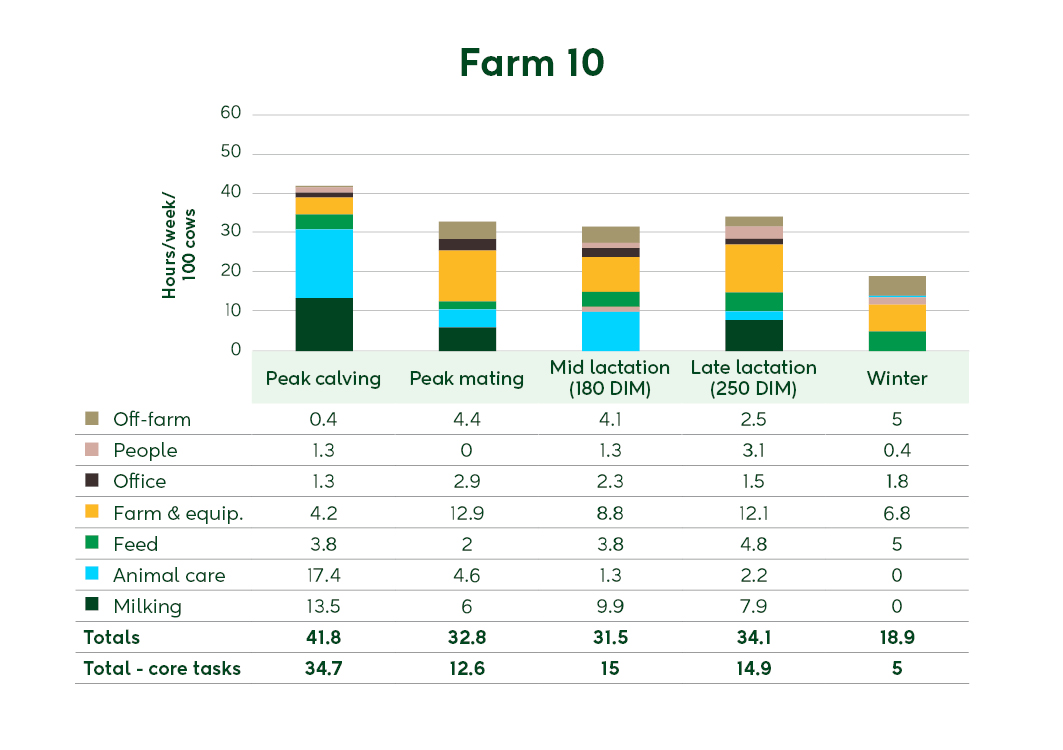
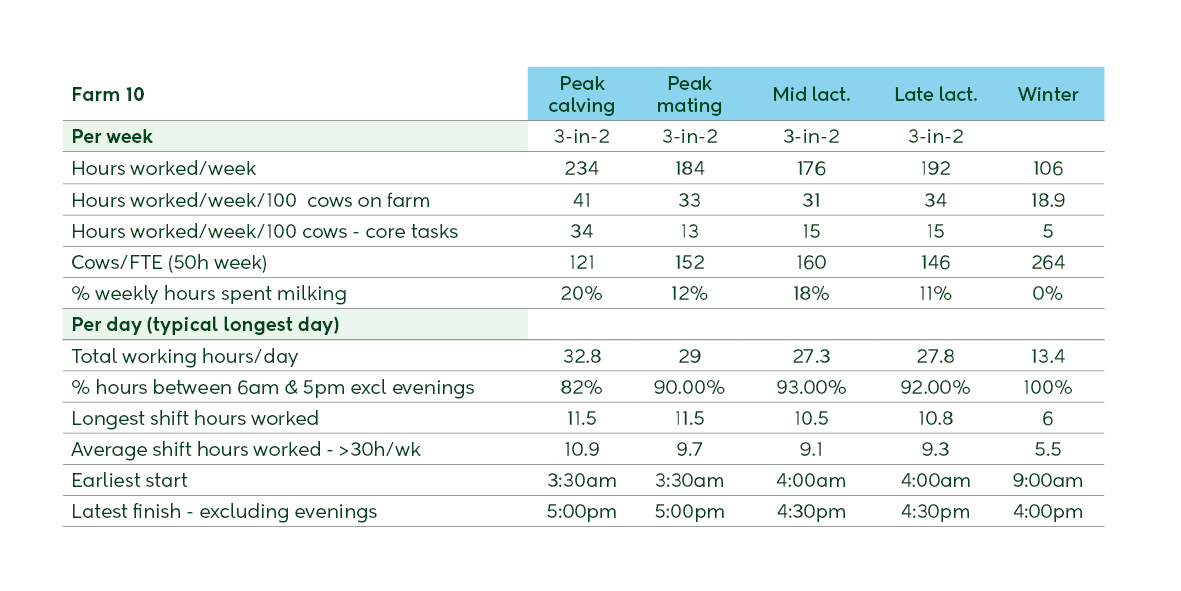
Farm 10: Canterbury | 560 cows | 10-in-7
1-person team, extended lactation, 235 cows/FTE
Factors improving workplace productivity and attractiveness
Technology and infrastructure
Business structure
Sharemilker contract may influence fewer hours on farm maintenance, as indicated in the data.
Limitations or potential improvements
Farmer suggests an auto plant wash would save time daily, particularly now that they are milking all year round.
Hours per week per 100 cows by task
Farming is demanding work, and how you structure your day matters for your business, your team, and your own wellbeing. The findings from the study highlight three clear opportunities to work smarter and improve workplace productivity:
1. Flexible milking is your biggest lever
Reducing milking frequency consistently freed up the most hours across farms in this study. Even small changes to your milking routine can have a large impact on daily workload, and those hours can go toward better work-life balance or higher-value tasks.
2. Good infrastructure and technology saves time every day
Farms with smart technology like auto-drafting, cup removers, and virtual fencing spent fewer hours on routine tasks. Identifying even one or two daily pinch points in your system and addressing them builds efficiency into every day.
3. People and culture matter as much as systems
The most productive farms were well-organised as well as well-equipped. Clear roles, good communication, and a positive team culture all shaped how effectively time was used and made farming more attractive for the whole team.
The overall goal of this research programme is to support farmers in improving workplace productivity and attractiveness. Our ambition at DairyNZ is to have viable options to improve workplace productivity by 30% by 2035.

Due to this being a case study report, the farms presented are not necessarily representative of ALL dairy farm systems across New Zealand.

The data provided was recorded by the farmers over the appropriate times, however timings and tasks were grouped by the researchers. “One-off” or low frequency tasks may have been pooled with other more frequent tasks.

As this is only a single year study, there is the possibility that some tasks may have a “knock-on” effect e.g. calf rearing into in-calf rates; and some tasks were influenced by the season’s weather and payout.
Now’s the perfect time to check in, plan, and set up for a strong season. We’ve pulled together smart tips and tools to help you stay ahead all winter long.
Whether you prefer to read, listen, or download handy guides, we’ve got you covered with trusted tools to support your journey every step of the way.
Put our proven strategies and seasonal tools to work. Boost production, support animal health and watch your profits hum.
Tools that are backed by science, shaped by farmers and made for this season.
That’s Summer Smarts.
Autumn Smarts brings together the research-backed tools that build resilience and boost performance.
The tools and insights you need to navigate the season with confidence. Backed by research and built for results – that’s Winter Smarts.


