Lincoln and Massey plantain farmlet and grazing trials
Topics
10 min read

As part of the DairyNZ-led Plantain Potency and Practice programme, trials at Lincoln and Massey universities tested how plantain affects nitrogen leaching, pasture persistence and farm productivity under different soil and climate conditions.
At Lincoln, pastures containing an average of 17% Ecotain® plantain reduced annual nitrate leaching by an average of 33% and annual total nitrogen leaching by an average of 17% over four years, with no significant effect on milksolids production or profit.
At Massey, pastures with plantain reduced annual nitrogen leaching by 20-60% in the first two years. Results in later years were influenced by seasonal conditions, pasture composition and lower overall leaching risk.
Across both sites, the research shows plantain can significantly reduce nitrogen losses while maintaining milk production.
The Lincoln and Massey sites also hosted a range of experimental work covering nitrous oxide emissions, methane emissions, plantain pasture management, animal health and effects of plantain on animal urine, milk and blood. Publications from these studies are provided at the end.
Plantain impact was assessed through trials at Lincoln and Massey universities, representing free-draining irrigated soils and heavy soils under high rainfall conditions, respectively.
At Lincoln University Research Dairy Farm (2021-2025), ryegrass/white clover pastures (PL0) were compared with ryegrass/white clover/plantain mixed pastures sown with 3 kg/ha (PL3) and 6 kg/ha (PL6) plantain (seed mixes below) in small pasture-based farm systems (‘farmlets’ of 3.6 ha and 12 cows). Each treatment was replicated three times, giving a total of nine farmlets.
Farmlets were managed individually, and farm productivity and profitability were measured throughout the study. Leaching was measured using ceramic suction cups under the PL0 and PL3 treatments. The volume of water draining through the soil surface was calculated based on rainfall and irrigation using a water balance model.

Leaching was measured using ceramic suction cups.
736 ceramic suction cups were installed at 600mm depth under the PL0 and PL3 paddocks at Lincoln to measure the concentration of nitrogen in drainage water.
At Massey University No. 4 Dairy (2020-2024), large, grazed plots with ryegrass/white clover pastures were compared with mixed ryegrass/white clover/plantain swards with low, medium and high plantain content in a high input system with supplement making up around 30% of the diet. Leaching was measured by capturing all drainage water through mole drains isolating each plot. Cows simultaneously grazed plots of every treatment (following a seven-day transition period) before completing their round on the rest of the farm. Production parameters were measured on the days cows were grazing the treatment plots.
Watch the video below for more about the Massey trial.

Video 07:00 min
Results showed that, over the four-year trial, the PL3 treatment, which contained an average of 17% plantain in sward dry matter, reduced annual nitrate leaching by an average of 33% compared with PL0 (ryegrass/white clover without plantain). Annual total nitrogen leaching was also reduced by an average of 17% (Table 1). There was no significant treatment by year effect, i.e. the differences between treatments persisted across the years.
| Average (2022-2025) | Nitrate Kg/ha/yr leached |
Total N (mineral N + organic N) Kg/ha/yr leached |
| Perennial ryegrass/clover (PL 0) | 18 (14-24) | 71 (64-79) |
| Perennial ryegrass/clover/plantain (PL3) | 12 (10-16) | 59 (53-65) |
| % reduction | 33% | 17% |
| P value (treatment effect) | 0.028 | 0.016 |
| P value (treatment by year effect) | 0.599 | 0.962 |
Note: Results are presented as back-transformed least square means with 95% confidence interval in brackets. These results are preliminary as we await development of peer-reviewed publications.
Aside from nitrate, total nitrogen includes ammonium and organic nitrogen. Treatment differences in these latter nitrogen forms were small and not significant with an 8% reduction in ammonium N (P = 0.231) and 7% reduction in organic N (P = 0.144). Organic N leaching was 43 kg/ha/yr in the ryegrass/clover and 39 kg/ha/yr in the ryegrass/clover/plantain.
Pastures were established with Legion perennial ryegrass, Tribute white clover and Ecotain® plantain in March 2021.
| Legion perennial ryegrass | Tribute white clover | Ecotain® plantain | |
| PL0 | 20 | 2 | |
| PL3 | 18 | 2 | 3 |
| PL6 | 15 | 2 | 6 |
Annual average and autumn plantain contents as a proportion of total dry matter are provided in Table 2b. Autumn is the recommended timing for assessing plantain as this is the highest risk period for leaching. The data shows that plantain levels peaked in Autumn 2022 before declining and then stabilising at 12-13% in PL3 and 14-16% in PL6.
| Year | Av. PL6 (% DM) |
Aut. PL6 (% DM) |
Av. PL3 (% DM) |
Aut. PL3 (% DM) |
| 2021/22 | 34 | 46 | 24 | 34 |
| 2022/23 | 20 | 17 | 16 | 12 |
| 2023/24 | 16 | 19 | 13 | 14 |
| 2024/25 | 16 | 14 | 13 | 12 |
| Average | 22% | 24% | 17% | 18% |
Note: These results are preliminary as we await development of peer-reviewed publications.
Over the four years, plantain content was maintained with over-sowing and under-sowing of Ecotain® plantain (see graph below).

Plantain % of total dry matter over four years in treatments sown with perennial ryegrass/white clover (PL0) and perennial ryegrass/white clover and 3 kg/ha (PL3) and 6 kg/ha (PL6) Ecotain. Interventions to maintain Ecotain are shown.
Milksolids production was similar between treatments (Table 3). Imported silage was higher in the PL6 treatment in 2022/23, associated with lower spring pasture production in PL6 that year. Silage fed in other years was similar between treatments. Nitrogen fertiliser applied was the same across all treatments averaging 149 kg/ha/yr.
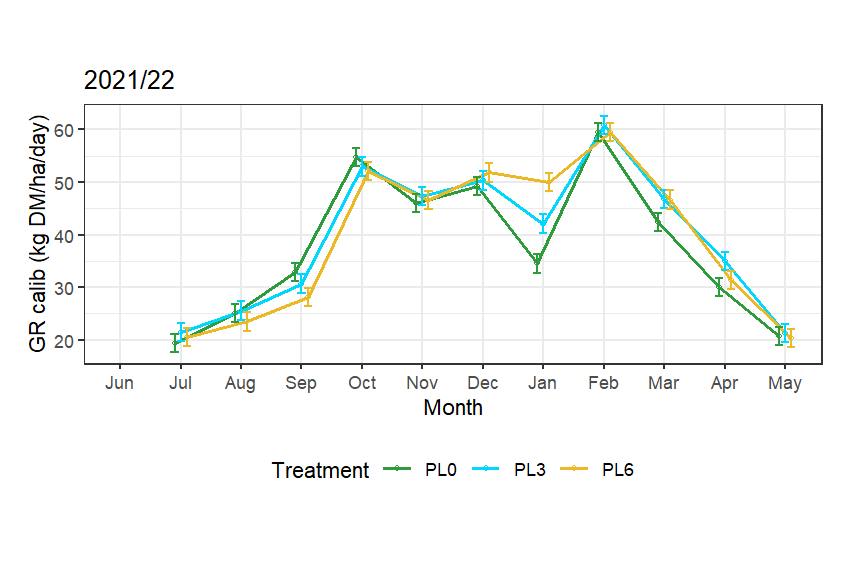
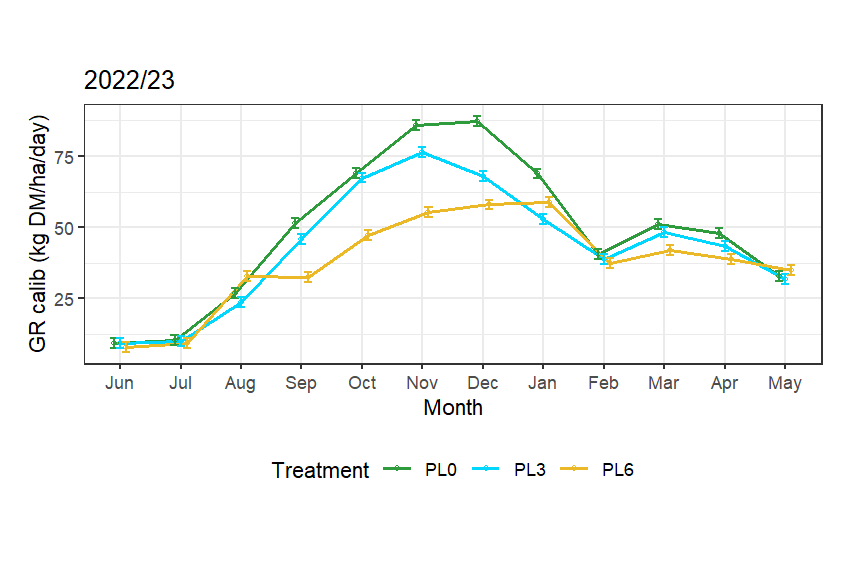
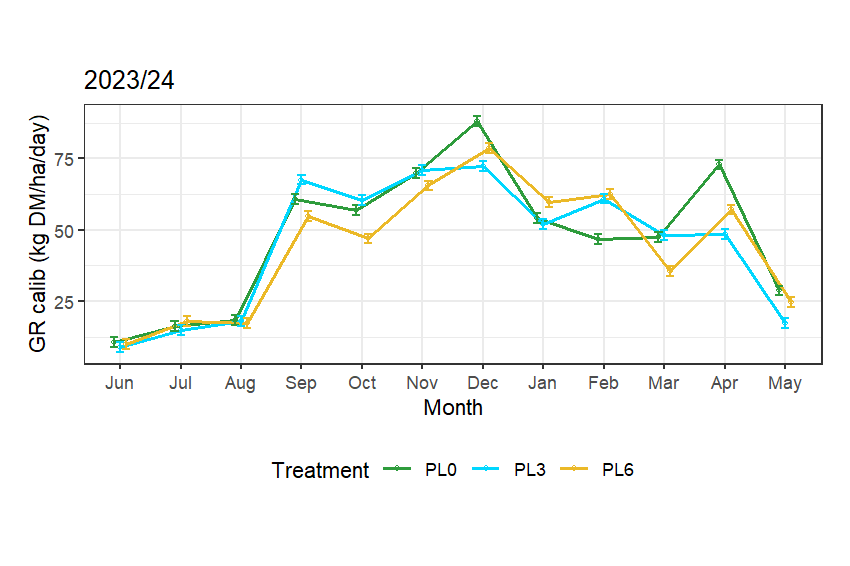
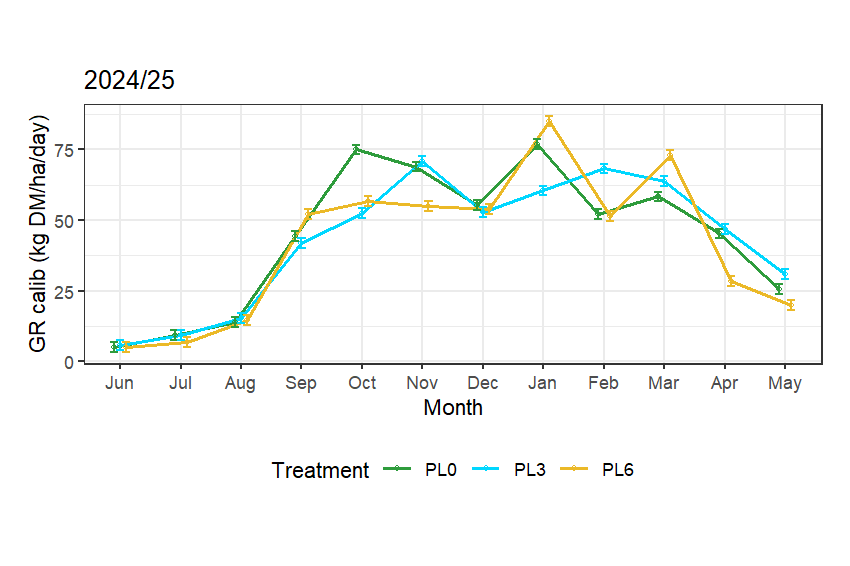
Herbage production was measured using multiple methods at the Lincoln site (Table 3). Results from using the rising plate metre with calibration cuts indicated larger treatment differences than using the standard winter equation, which does not account for the lower dry matter percentage of plantain. Using the winter equation, PL6 produced more than PL0 in the first year. With the calibrated equation, differences in the first year were not significant, but PL0 produced more than treatments with plantain in the following years. The back-calculated value from the Farmax model uses milk production and supplement to estimate herbage production. Herbage production was similar between treatments using this method.
At the Lincoln site, a new calibrated equation was developed for the rising plate metre, accounting for lower dry matter percentage of plantain.
Different letters represent significant treatment differences within a year (P<0.05).
| Herbage production t DM/ha | ||||||
| Year | Treatment | Milksolids (kg/ha) |
RPM standard equation |
RPM calibrated |
Farmax back calculation |
Imported silage (t/ha) |
| 2021/22 | PL0 | 1367 | 12.4a | 12.5 | 14.3 | 0.38 |
| PL3 | 1335 | 12.9ab | 13.0 | 14.3 | 0.28 | |
| PL6 | 1367 | 13.6b | 12.9 | 14.7 | 0.09 | |
| 2022/23 | PL0 | 1570 | 14.0 | 18.7c | 16.5 | 1.56a |
| PL3 | 1496 | 14.2 | 16.1b | 15.8 | 1.46a | |
| PL6 | 1503 | 13.4 | 14.5a | 15.0 | 2.18b | |
| 2023/24 | Pl0 | 1472 | 13.5 | 17.3b | 16.4 | 1.78 |
| PL3 | 1508 | 13.3 | 16.3a | 16.7 | 2.00 | |
| PL6 | 1492 | 13.3 | 16.2a | 15.8 | 2.15 | |
| 2024/25 | PL0 | 1554 | 14.2 | 16.3b | Not available | 0.86 |
| Pl3 | 1543 | 14.2 | 15.7ab | Not available | 1.03 | |
| PL6 | 1533 | 14.6 | 15.2a | Not available | 0.95 | |
| P value treatment | 0.528 | 0.789 | <0.001 | 0.553 | 0.089 | |
| P value year | <0.001 | <0.001 | <0.001 | <0.001 | <0.001 | |
| P value treatment x year | 0.476 | 0.003 | <0.001 | 0.147 | 0.009 | |
Note: These results are preliminary as we await development of peer-reviewed publications.


An economic analysis using the Farmax model has been completed comparing PL0 to PL3 in Years 1-3 (Table 4). Actual Fonterra milk prices were used – NZD $7.92, $9.26, and $7.80 for Years 1 to 3 respectively (2021/22 – 2023/24). The analysis showed no significant treatment difference in revenue or profit over the three years.
Farm expenses were higher in the PL3 treatment, approximately equivalent to the costs of reseeding in each year (Table 2), which averaged $95/ha. Canterbury farmers partnering in the Plantain programme are maintaining plantain by spreading lower rates of plantain (2 kg/ha/year) with their annual maintenance fertiliser at a cost of around $46/ha.
An analysis of all treatments and years will be completed and published in due course.
| Year | Treatment | Revenue (S/ha) |
Reseed expenses ($/ha) |
Total expenses ($/ha) |
Operating profit ($/ha) |
| 2021/22 | PL0 | 11,282 | 6,836 | 4,446 | |
| PL3 | 11,023 | 43 | 6,873 | 4,150 | |
| 2022/23 | PL0 | 14,936 | 6,822 | 8,114 | |
| PL3 | 14,306 | 142 | 6,942 | 7,364 | |
| 2023/24 | PL0 | 12,025 | 6,733 | 5,293 | |
| PL3 | 12,304 | 100 | 6,871 | 5,433 | |
| P value treatment | 0.355 | <0.001 | 0.183 | ||
| P value year | <0.001 | 0.005 | <0.001 | ||
| P value treatment x year | 0.251 | 0.054 | 0.274 | ||
The pasture treatments at Massey were sown in April 2019 and targeted 30% (Low, LPL), 50% (Medium, MPL) and 70% (High, HPL) plantain. Seed mixes and reseeding were applied as per Table 5. The High plantain treatment was resown in April 2021 to achieve the 70% target and was subsequently oversown with Italian ryegrass in March 2023 when clover levels became too high. The actual plantain percentage achieved in each treatment each year was generally lower than target.
Treatments are perennial ryegrass/white clover (RGWC), and targeting 30, 50 and 70% plantain within a RGWC sward (Low, Medium and High PL respectively).
| Pasture treatments | ||||
| Establishment | RGWC | LPL | MPL | HPL |
| Perennial ryegrass (One50) | 20 | 15 | 10 | 5 |
| White clover (Tribute) | 3 | 3 | 3 | 3 |
| Plantain (Agritonic) | 0 | 4 | 7 | 10 |
| Reseeding1 | ||||
| March 2020 | 3 (PL) | 6 (PL) | 9 (PL) | |
| April 2021 | 10 (PL) + 3 (WC) + 3 (RG) |
|||
| November 2021 | 4 (PL) | 6 (PL) | 8 (PL) | |
| March 2023 | 4 (PL) | 6 (PL) | 12 (PL) | |
1Reseeding (direct drilled) of extra plantain (PL), perennial ryegrass (RG), Italian ryegrass (IR), or white clover (WC)
The graph below shows when resowing occurred and the effect on the average plantain percentage in the sward for each pasture treatment (ryegrass and white clover sward (RGWC; targeting 0% plantain in sward); LPL, MPL, HPL (targeting 30, 50 and 70% of plantain in sward, respectively) across production years.

Compared to a sward sown with perennial ryegrass/clover, average annual total N and nitrate leaching were significantly lower in the plantain treatments in the first two years of the Massey experiment (Table 6).
In Year 3, leaching was higher in the High PL treatment, when re-establishment of plantain and clover in Year 2 resulted in very high clover (33%) and low ryegrass (13%), with 46% plantain. The higher leaching resulted from the combination of pasture re-establishment (spraying, soil disturbance), high clover, and low ryegrass (and therefore lower winter activity) to utilise the extra nitrogen fixed from clover and mineralised from the soil. This was mitigated by oversowing with Italian ryegrass to utilise the extra nitrogen before Year 4. Leaching was numerically lower in the Low and Medium PL treatments than in the RGWC in Year 3, though treatment differences were not significant.
In Year 4, wet conditions meant low stocking densities through spring, and high amounts of silage made, to protect the paddocks from damage. The wet spring conditions were followed by a dry autumn and winter, resulting in low drainage. These conditions resulted in low leaching, masking any plantain treatment effect in Year 4. Year 5 was also characterised by low drainage, high pasture growth rates, lower than optimum stocking densities and high silage removal, also resulting in low leaching.
Where superscript letters are different, there is a statistically significant treatment difference.
| Year | Treatment | Plantain % of DM in sward |
Plantain % of DM in diet |
Total N leached (kg N/ha) |
Nitrate-N leached (kg N/ha) |
| Year 1: 2019/20 | Ryegrass | 6a | 4a | 16a | 11a |
| Low PL | 29b | 20b | 9b | 5b | |
| Med PL | 34c | 28c | 10b | 4b | |
| High PL | 49d | 35d | 10b | 5b | |
| Year 2: 2020/21 | Ryegrass | 3a | 2a | 29a | 25a |
| Low PL | 32b | 24b | 23b | 19b | |
| Med PL | 47c | 35c | 18c | 13c | |
| High PL | 46c | 34c | 23b | 18b | |
| Year 3: 2021/22 | Ryegrass | 2a | 1a | 19a | 10a |
| Low PL | 20b | 15b | 16a | 9a | |
| Med PL | 24c | 18c | 16a | 8a | |
| High PL | 46d | 34d | 23b | 15b | |
| Year 4: 2022/23 | Ryegrass | 4a | 3a | 10 | 6 |
| Low PL | 24b | 15b | 9 | 5 | |
| Med PL | 28b | 17b | 8 | 4 | |
| High PL | 32c | 21c | 10 | 6 | |
| Year 5: 2023/24 | Ryegrass | 4a | 3a | 14 | 6 |
| Low PL | 13b | 10b | 13 | 6 | |
| Med PL | 20c | 13b | 10 | 4 | |
| High PL | 16bc | 11b | 13 | 6 | |
| Average: 2019/24 | Ryegrass | 4a | 2a | 18 | 12b |
| Low PL | 24b | 17b | 14 | 9ab | |
| Med PL | 32c | 22c | 12 | 7a | |
| High PL | 38d | 27d | 16 | 10ab | |
| P value* treatment | <0.001 | <0.001 | 0.1010 | 0.032 | |
| P value year | <0.001 | <0.001 | <0.001 | <0.001 | |
| P value treatment x year** | <0.001 | <0.001 | 0.002 | <0.001 | |
Note: Results are preliminary as we await development of peer-reviewed manuscripts.
* P value: An indication of how likely the result is due to chance. The smaller the P value, the more confident we can be that the observed difference is meaningful rather than random. Values below 0.05 are considered statistically significant.
**Treatment x year interaction: Where the treatment × year interaction is statistically significant, treatment differences were not consistent across years. In this case, results should be interpreted separately for each year rather than drawing conclusions from the overall average across years.
There were no treatment differences in milk production. Pasture yield was similar between treatments except Year 4, which was characterised by wet winter/spring conditions and had higher pasture growth in the ryegrass/clover treatment compared to all plantain treatments.
Ryegrass and white clover sward (RGWC), and RGWC plus Low, Medium, or High plantain.
| Herbage treatment | ||||
| Season | Ryegrass/clover | Low plantain | Medium plantain | High plantain |
| 2019/20 (Year 1*) | 15.3 | 14.9 | 15.1 | 15.3 |
| 2020/21 (Year 2) | 15.8 | 16.9 | 17.3 | 16.6 |
| 2021/22 (Year 3) | 14.7 | 14.3 | 14.3 | 10.9** |
| 2022/23 (Year 4) | 14.3a | 12.5b | 12.9b | 12.5b |
| 2023/24 (Year 5) | 16.6 | 15.7 | 15.6 | 15.9 |
Note: Different letters show significant differences (P< 0.05) between herbage treatments within year.
*Data collection started in Sept 2019 (after pastures were established in April 2019). Year 1 includes data for 9 months (Sept-May).
**Due to the high plantain treatment being re-sown in autumn of 2021, no pasture yield data for the high plantain treatment were collected in the winter of 2021. This number therefore only represents the cumulative total of spring to autumn.

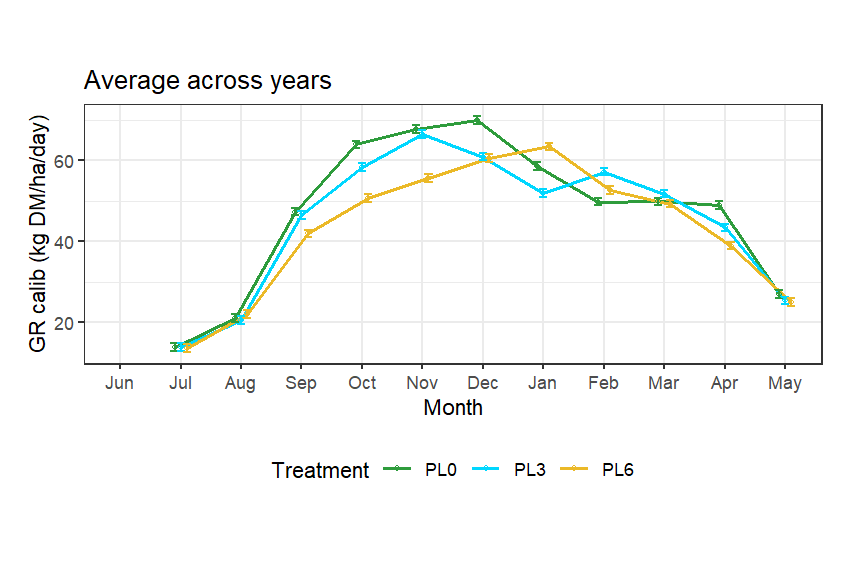
Monthly pasture growth rate (kg DM/ha/day, ± standard error) for the Ryegrass White Clover (RGWC), and Low (LPL), Medium (MPL) and High (HPL) plantain treatments from Sept 2019 to May 2024.
The Lincoln and Massey trials are part of the Primary Sector Growth Fund Plantain Potency and Practice Programme, a seven-year collaborative research initiative led by DairyNZ and funded by the Ministry for Primary Industries, DairyNZ, PGG Wrightson Seeds and Fonterra. Research is delivered in partnership with Lincoln University, Massey University, Lincoln Agritech and the Bioeconomy Science Institute (BSI).
Visit the main programme page to learn more about the research and farmer guidance being developed to support plantain use on farm.
Lincoln
Al-Marashdeh, O., Herath, HMGP., Thomas, C., McMillan, N., Tanner, J., Woods, RR., and Bryant, RH. (2026). Calibration of a rising plate meter for herbage mass estimation in ryegrass-white clover mixed swards containing different proportions of plantain (Plantago lanceolata L.). 2026. The Journal of Agricultural Science. 1-26. doi:10.1017/S0021859626100690
Herath, G., Thomas, C., McMillan, N., Woods, R., Bryant, R., and Al- Marashdeh, O. (2023). Incorporating Plantain into Ryegrass-White Clover Mixed Sward for an Economically and Environmentally Sustainable Dairy System: Year One of a Farm System Study: Plantain-Based Pasture for Sustainable Dairy Systems. Journal of New Zealand Grasslands 85: 321–331. https://doi.org/10.33584/jnzg.2023.85.3635
Hintz, K., Woods, RR., McMillan, N., Thomas, C., Bryant, RH. and Al-Marashdeh, O. (2026). Incorporating Plantain Into a Perennial Ryegrass–White Clover Mixed Sward for an Environmentally Sustainable Dairy System: A Three-Year Farm System Study. New Zealand Journal of Agricultural Research 69(2), e70041.
Massey
Navarrete, S., Kemp, P. D., Pinxterhuis, J. B., Minnée, E. M. K., & Fransen, K. E. (2023). Evidence of environmental benefits of plantain pastures. In Proceedings of the XXV International Grassland Congress (pp. 1846-1879). https://doi.org/10.52202/071171-0453
Nguyen, T.T., Navarrete, S., Horne, D., Donaghy, D., Kemp, P. (2024). Milk production and nitrogen excretion of grazed dairy cows in response to plantain (Plantago lanceolata) content and lactation season. Animal Bioscience https://doi.org/10.5713/ab.23.0400
Nguyen, T.T., Navarrete, S., Horne, D.J., Donaghy, D.J., Bryant, R.H. and Kemp, P.D. (2023). Dairy cows grazing plantain-based pastures have increased urine patches and reduced urine N concentration that potentially decreases N leaching from a pastoral system. Animals 13, 528, 12 pages. https://doi.org/10.3390/ani13030528
Nguyen, T.T., Navarrete, S., Horne, D., Donaghy, D.J. and Kemp, P.D. (2022). Incorporating plantain with perennial ryegrass - white clover in a dairy grazing system: dry matter yield, botanical composition, and nutritive value response to sowing rate, plantain content and season. Agronomy 12, 2789, 14 pages https://doi.org/10.3390/agronomy12112789
Nguyen, T.T., Navarrete, S., Horne, D.J., Donaghy, D.J., and Kemp, P.D. 2022. Effect of plantain content in ryegrass-based dairy pastures on nitrate leaching and key components of the nitrogen cycle. In: Adaptive Strategies for Future Farming. (Eds. C.L. Christensen, D.J. Horne and R. Singh). http://flrc.massey.ac.nz/publications.html Occasional Report No. 34. Farmed Landscapes Research Centre, Massey University, Palmerston North, New Zealand.
Sivanandarajah, K., Molano, G., Donaghy, D., Horne, D., Kemp, P., Navarrete, S., Ramilan, T., & Pacheco, D. (2024). Plantain-mixed pasture collected in different climatic seasons produced less methane and net ammonia than ryegrass-white clover pasture. 20 Years of ADSS: timeless practices, re-innovation, and future thinking. Australasian Dairy Science Symposium 2024, Christchurch, New Zealand. https://doi.org/10.1071/AN24287
Sivanandarajah, K., Donaghy, D., Kemp, P., Navarrete, S., Horne, D., Ramilan, T., Molano, G., & Pacheco, D. (2025). Effects of Plantain (Plantago lanceolata L.) Metabolites Aucubin, Acteoside, and Catalpol on Methane Emissions In Vitro. Journal of Agricultural and Food Chemistry. https://doi.org/10.1021/acs.jafc.4c12140
Wilson S, Donaghy D, Horne D, Navarrete S, Kemp P. (2024). Investigating the impact of treading damage on the plantain (Plantago lanceolata L.) content and performance of a plantain/perennial ryegrass (Lolium perenne L.) pasture over two years. Journal of New Zealand Grasslands, 31, 97-107. https://dx.doi.org/10.33584/jnzg.2024.86.3682
Wilson, S.S., Donaghy, D. J., Horne, D. J., Navarrete, S., & Kemp, P. D. (2024). An inexpensive and effective method for simulating cattle treading damage on pasture. Opportunities for improved farm and catchment outcomes. Occasional Report No. 36. Farmed Landscapes Research Centre, Massey University, Palmerston North, New Zealand. https://www.massey.ac.nz/~flrc/workshops/24/Manuscripts/Wilson_Sam.pdf
Wilson, S., Donaghy, D., Horne, D., Navarrete, S., & Kemp, P. (2023). Plantain (Plantago lanceolata L.) content within plantain/ perennial ryegrass (Lolium perenne L.) pastures may be limited by livestock treading damage. Journal of New Zealand Grasslands, 85, 177–186. https://doi.org/10.33584/jnzg.2023.85.3634
Wilson, S.; Donaghy, D.; Horne, D.; Navarrete, S.; Kemp, P.; Rawlingson, C. Plantain (Plantago lanceolata L.) Leaf Elongation and Photosynthesis Rates Are Reduced under Waterlogging. Biol. Life Sci. Forum 2023, 27, 26. https://doi.org/10.3390/IECAG2023-14976
Wilson, S. S., Donaghy, D. J., Horne, D. J., Navarrete, S., & Kemp, P. D. Plantain (Plantago lanceolata L.) Growth is limited under waterlogging., in Proceedings of the International Grasslands Congress, May 2023: Kentucky, USA. UKnowledge - IGC Proceedings (1997-2023): Plantain (Plantago lanceolata L.) Growth Is limited Under Waterlogging (uky.edu)
Vi, C.; Kemp, P.D.; Saggar, S.; Navarrete, S.; Horne, D.J. (2023). Effective Proportion of Plantain (Plantago lanceolata L.) in Mixed Pastures for Botanical Stability and Mitigating Nitrous Oxide Emissions from Cow Urine Patches. Agronomy, 13, 1447. https://doi.org/10.3390/agronomy13061447
Vi. C, Kemp P., Saggar S., Navarrete S., Horne D., 2022. Plantain mixed pastures: Botanical composition and nitrous oxide emissions for cow urine patches. In: Adaptive Strategies for Future Farming. (Eds. C.L. Christensen, D.J. Horne and R. Singh). http://flrc.massey.ac.nz/publications.html. Occasional Report No. 34. Farmed Landscapes Research Centre, Massey University, Palmerston North, New Zealand. 12 pages
Now’s the perfect time to check in, plan, and set up for a strong season. We’ve pulled together smart tips and tools to help you stay ahead all winter long.
Whether you prefer to read, listen, or download handy guides, we’ve got you covered with trusted tools to support your journey every step of the way.
Put our proven strategies and seasonal tools to work. Boost production, support animal health and watch your profits hum.
Tools that are backed by science, shaped by farmers and made for this season.
That’s Summer Smarts.
Autumn Smarts brings together the research-backed tools that build resilience and boost performance.
The tools and insights you need to navigate the season with confidence. Backed by research and built for results – that’s Winter Smarts.