Forages for Reduced Nitrate Leaching, Chris Nigel and Ross Rathgen (Canterbury)
Topics
13 min read
13 min read
The Rathgen family manage a mixed dairy and arable farm in St Andrews. Your farm, if similar, could benefit from their insights after joining the FRNL programme. They believe FRNL bridges the gap between environmental concerns and on-farm activities. This programme offers them updated information, enabling them to reduce their environmental impact while boosting their economic benefits. They've also explored different management practices and modelled their effects. Networking with like-minded individuals is another perk. Joining such initiatives can help you stay ahead of new regulations and farm more sustainably, bringing both environmental and economic benefits to the wider farming community.
Area:
312 ha effective milking platform, 137 ha arable
Dominant soils:
Claremont silty loam and Waitohi silty loam.
Average rainfall:
approx. 580 mm
Trading as:
St. Andrews Dairy Limited and Glen River Farm Limited
“I thought it would be a good way to get some new ideas and network with some new people in the industry.”
"To keep ahead of new regulations and to farm as environmentally as possible."
“Hopefully environmentally and economically.”
Nigel Rathgen discuss following an autumn grazed fodder beet crop with a catch crop.
The dairy farm has an effective milking platform area of 312 ha. At the start of the programme this was 94% irrigated and stocked at a stocking rate of 3.8 cows/ha. The farm also has an 80 ha dryland support block providing winter grazing.
Since being involved in the FRNL programme, the Rathgens have:
Nitrogen (N) fertiliser use was stable; supplement use and stock numbers have fluctuated. Differences in N leaching between years were maximal 11%.
2015/16
Reducing stocking rate, imported supplement and establishing plantain as part of a mixed sward
This season some large farm system changes occurred. These included reducing the stocking rate by 0.5 cows/ha, reducing the total imported supplement from 918 to 551 kg DM/cow, and establishing plantain as part of a mixed sward. Similar rates of N fertiliser were used to earlier years (297 kg N/ha).
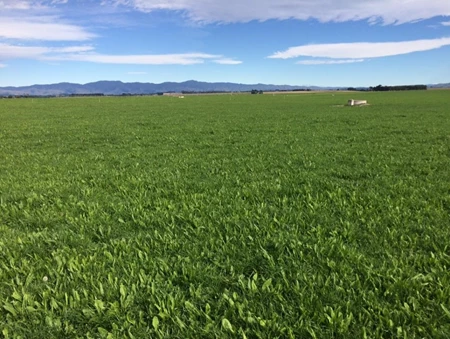
Plantain
2016/17
Growing fodder beet on the platform for autumn feed, reducing imported supplement and continuing to establish plantain as part of a mixed sward
This season was largely about refining systems after the large change that occurred in the 2015-16 season. The main system change that was implemented was the inclusion of 6 ha (2% of milking platform) of fodder beet on the milking platform for use as autumn feed and to begin transitioning for winter fodder beet.
The amount of imported supplement was further reduced from 551 to 391 kg DM/cow. Pasture harvested increased slightly, replacements ran on the milking platform for parts of October, December, January and March to control pasture surpluses, and milk production remained steady.
Fodder beet
2017/18
Introducing catch crop, increasing area of fodder beet, increasing imported supplement and continuing to establish plantain as part of a mixed sward
A catch crop of oats and Italian ryegrass were grown following last autumn’s fodder beet and this was harvested in November. The area of fodder beet established was increased to 12.4 ha. However, having this area out of rotation made logistics challenging. Slightly less N fertiliser was used, 280 kg N/ha (compared with 300 kg N/ha in 2016-17). However, this was offset by an increase in imported supplement from 391 to 657 kg DM/cow.
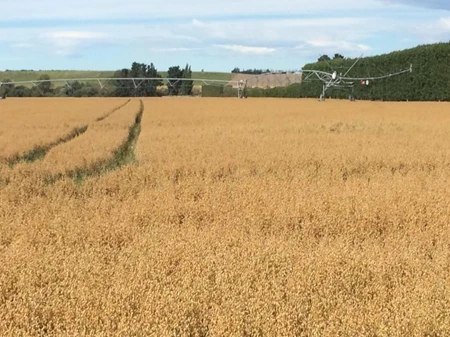
Catch crops
The Rathgens took part in an oats/Italian ryegrass catch crop trial, with oats and Italian being sown immediately after the fodder beet was finished being grazed (mid-June).
2018/19
Increasing imported supplement use due to dry summer and autumn, continuing to establish plantain as part of a mixed sward
The oats-Italian catch crop established after last autumn’s fodder beet was harvested in December – a month later than planned due to weather. This achieved more yield but poorer quality. Fodder beet for autumn feed was established in two smaller paddocks (9 ha) to reduce area out while maintaining the logistical advantages of having two paddocks. N fertiliser increased slightly from 280 to 287 kg N/ha and a greater proportion was applied in autumn due to poor growing conditions. Feed deficit also resulted in an increase in imported supplement from 657 to 908 kg DM/cow. This increased use of inputs in autumn increased the purchased N surplus and estimated N leaching. The results of this year illustrate how a few poor autumn months can determine the overall environmental performance, with Overseer’s N leaching based on long-term average weather conditions.
Arable farm – Annual summary of modelling study
The Simple Crop Resource Uptake Model operating within the Agricultural Production Systems sIMulator (SCRUM-APSIM) was used to simulate N balances on the arable part of the farming enterprise.
Model estimates indicated minimal drainage and N leaching, due to the farm being characterised by Claremont soils, which are heavy and poorly drained.
Modelling outcomes identified the following factors that increased the amount of leachable soil N:
Evaluation of N remaining in the soil at the end of the season
Strategies that can reduce the amount of soil N available for leaching include:
Evaluation of N remaining in the soil at the end of the season indicated high N values for some paddocks, but prompt sowing after the harvest of previous crops allowed utilisation of residual soil N. The farm also implements under-sowing which provides continuous crop cover, but the benefits cannot be estimated because this management practice is not yet implemented in SCRUM-APSIM.
Leaching was greater when at least two of these factors were in play. For example, excessive N application to spring-sown crops resulted in high residual soil N at risk of leaching if no crops were sown after the summer harvest to take up the N. Similarly, mineralised N from residues retained in paddocks was available for leaching if there was no vegetation to take up water and N and reduce drainage/leaching.
Denitrification and run-off were assessed as additional pathways of N loss due to the poorly drained Claremont soils on farm. The results indicated an association with poorly drained soils with increases in denitrification and run-off.
Indicative model estimates of whole farm average denitrification (kg N/ha) and run-off (mm) for each of the four seasons:
| Season | Denitrification (kg N/ha) | Run-off (mm) |
| 2015-16 | 0.6 | 1.7 |
| 2016-17 | 1.2 | 0.8 |
| 2017-18 | 5.5 | 46 |
| 2018-19 | 9.5 | 33 |
Overall results have shown that leaching is mainly influenced by rainfall through its impact on drainage, but farm management practices determine the amount of soil N at risk of leaching.
A full report on the catch crop results of the Canterbury dairy monitor farms.
The average N leaching values generated at 150 cm depth were marginal, ranging from 0 to 7.4 kg N/ha. These low figures reflect the low estimated drainage of the poorly drained Claremont soils which are dominant on the farm. N leaching estimates generated at a soil depth of 60 cm were greater than those estimated at 150 cm depth, but there was similarity in patterns across seasons. Greater values of N leaching and drainage at 60 cm are expected because most crops grown on the farm have deep roots that allow water and N extraction in layers that are deeper than 60 cm.
N leaching and drainage over four seasons (season = 01 Apr - 31 Mar) as estimated by SCRUM-APSIM at a depth of 150cm
| Paddock | Leaching (kg N/ha) | Drainage (mm) | ||||||
| 2015-16 | 2016-17 | 2017-18 | 2018-19 | 2015-16 | 2016-17 | 2017-18 | 2018-19 | |
| R02 | 0.0 | 0.0 | 7.1 | 9.5 | 0.0 | 0.0 | 105 | 124 |
| R03 | 0.0 | 0.0 | 0.9 | 1.2 | 0.0 | 0.0 | 51 | 51 |
| R04 | 0.0 | 0.0 | 0.9 | 1.2 | 0.0 | 0.0 | 51 | 47 |
| R05 | 0.0 | 0.0 | 1.1 | 20.8 | 0.0 | 0.0 | 23 | 276 |
| R06 | 0.0 | 0.0 | 5.0 | 6.6 | 0.0 | 0.0 | 99 | 107 |
| R07 | 0.0 | 0.0 | 1.6 | 3.1 | 0.0 | 0.0 | 66 | 68 |
| R08 | 0.0 | 0.0 | 3.0 | 4.5 | 0.0 | 0.0 | 93 | 190 |
| R09 | 0.0 | 0.0 | 2.9 | 8.3 | 0.0 | 0.0 | 58 | 113 |
| R10 | 0.0 | 0.0 | 0.3 | 5.1 | 0.0 | 0.4 | 14 | 141 |
| R11 | 0.0 | 0.0 | 0.9 | 4.1 | 0.0 | 0.0 | 32 | 90 |
| R12 | 0.0 | 0.0 | 0.8 | 8.0 | 0.0 | 0.0 | 32 | 173 |
| R13 | 0.0 | 0.0 | 5.7 | 6.7 | 0.0 | 0.0 | 96 | 151 |
| R14 | 0.0 | 0.0 | 6.6 | 12.3 | 0.0 | 0.0 | 113 | 93 |
| R15 | 0.0 | 0.0 | 2.4 | 6.1 | 0.0 | 0.0 | 64 | 74 |
| R16 | 0.0 | 0.0 | 1.3 | 5.5 | 0.0 | 0.0 | 41 | 93 |
| R17 | 0.0 | 0.0 | 4.1 | 5.7 | 0.0 | 0.0 | 78 | 76 |
| R18 | 0.0 | 0.0 | 3.0 | 3.8 | 0.0 | 0.0 | 125 | 76 |
| R19 | 0.0 | 0.0 | 1.9 | 9.6 | 0.0 | 0.0 | 48 | 174 |
| R21 | 0.0 | 0.1 | 4.7 | 24.3 | 0.0 | 3.0 | 81 | 265 |
| Whole-farm average | 0.0 | 0.0 | 3.1 | 7.4 | 0.0 | 0.1 | 70 | 117 |
N leaching and drainage over four seasons (season = 01 Apr - 31 Mar) as estimated by SCRUM-APSIM at a depth of 60cm.
| Paddock | Leaching (kg N/ha) | Drainage (mm) | ||||||
| 2015-16 | 2016-17 | 2017-18 | 2018-19 | 2015-16 | 2016-17 | 2017-18 | 2018-19 | |
| R02 | 1.3 | 10.6 | 24.9 | 7.5 | 0 | 8 | 152 | 138 |
| R03 | 0.0 | 0.5 | 3.7 | 19.0 | 0 | 17 | 79 | 90 |
| R04 | 0.0 | 1.1 | 3.7 | 18.7 | 0 | 17 | 79 | 87 |
| R05 | 0.2 | 11.6 | 26.2 | 4.7 | 0 | 24 | 64 | 280 |
| R06 | 0.0 | 8.7 | 28.4 | 9.4 | 0 | 29 | 172 | 144 |
| R07 | 2.8 | 1.3 | 16.8 | 37.3 | 0 | 27 | 96 | 95 |
| R08 | 0.0 | 1.6 | 12.9 | 2.4 | 0 | 14 | 168 | 191 |
| R09 | 0.0 | 1.5 | 38.8 | 33.4 | 0 | 24 | 76 | 138 |
| R10 | 0.0 | 2.3 | 7.5 | 12.1 | 0 | 24 | 63 | 153 |
| R11 | 0.1 | 1.7 | 30.7 | 36.2 | 1.5 | 17 | 87 | 147 |
| R12 | 0.0 | 3.9 | 15.3 | 9.9 | 0 | 11 | 64 | 177 |
| R13 | 0.0 | 2.5 | 16.6 | 39.2 | 0 | 15 | 127 | 179 |
| R14 | 1.4 | 11.5 | 33.4 | 51.0 | 0 | 19 | 150 | 130 |
| R15 | 1.4 | 3.9 | 19.4 | 7.6 | 2.9 | 25 | 85 | 103 |
| R16 | 0.0 | 1.6 | 13.1 | 9.1 | 0 | 16 | 76 | 123 |
| R17 | 0.0 | 3.0 | 31.7 | 10.2 | 0 | 14 | 112 | 91 |
| R18 | 0.1 | 0.7 | 4.3 | 25.7 | 0.3 | 18 | 158 | 102 |
| R19 | 0.0 | 12.3 | 14.0 | 3.6 | 0 | 21 | 94 | 178 |
| R21 | 1.9 | 18.5 | 38.2 | 30.0 | 11.6 | 29 | 109 | 287 |
| Whole-farm average | 0.5 | 6.3 | 20.0 | 21.8 | 0.7 | 19 | 109 | 143 |
Farm records show that most paddocks were sown in crops soon after completion of grazing and harvesting events, allowing the utilisation of residual soil N and N returned in manure and urine. Farm records showed a reduction in the average N fertiliser applied over the studied seasons.
Total N application (fertiliser and estimates of manure and urine return) and N uptake (as estimated by SCRUM-APSIM) over four seasons (season = 01 Apr - 31 Mar)
| Paddock | Applied fertiliser + excreta (kg N/ha) | N uptake (kg N/ha) | ||||||
| 2015-16 | 2016-17 | 2017-18 | 2018-19 | 2015-16 | 2016-17 | 2017-18 | 2018-19 | |
| R02 | 269 | 249 | 198 | 158 | 295 | 341 | 226 | 216 |
| R03 | 54 | 42 | 0 | 221 | 288 | 149 | 114 | 276 |
| R04 | 54 | 44 | 0 | 221 | 97 | 147 | 112 | 276 |
| R05 | 198 | 0 | 39 | 35 | 217 | 124 | 119 | 31 |
| R06 | 27 | 0 | 189 | 83 | 141 | 78 | 242 | 159 |
| R07 | 240 | 152 | 192 | 263 | 229 | 160 | 255 | 276 |
| R08 | 238 | 89 | 184 | 35 | 314 | 156 | 230 | 81 |
| R09 | 54 | 163 | 177 | 166 | 70 | 153 | 169 | 232 |
| R10 | 191 | 46 | 52 | 86 | 182 | 117 | 96 | 158 |
| R11 | 159 | 240 | 231 | 204 | 154 | 248 | 297 | 310 |
| R12 | 104 | 46 | 58 | 136 | 112 | 107 | 100 | 137 |
| R13 | 201 | 95 | 182 | 212 | 195 | 159 | 231 | 227 |
| R14 | 209 | 256 | 240 | 221 | 225 | 344 | 286 | 296 |
| R15 | 17 | 81 | 205 | 243 | 140 | 187 | 287 | 281 |
| R16 | 228 | 185 | 0 | 35 | 217 | 181 | 142 | 214 |
| R17 | 253 | 143 | 187 | 152 | 244 | 139 | 328 | 288 |
| R18 | 195 | 155 | 37 | 221 | 116 | 287 | 78 | 276 |
| R19 | 100 | 197 | 189 | 43 | 94 | 207 | 257 | 72 |
| R21 | 118 | 46 | 228 | 102 | 78 | 226 | 228 | 169 |
| Whole-farm average | 166 | 130 | 139 | 161 | 186 | 195 | 205 | 223 |
Estimating N fertiliser rates
The industry-agreed Good Management Practice for nutrient management is to match the nutrient supply from the soil and fertiliser to the demand from the crop to reach its expected yield. To do this with confidence, farmers require reliable information and methods for working out how much fertiliser to apply to their crops.
Comparisons were carried out in crops sown in spring 2017
Comparisons were carried out in crops sown in spring 2017, comparing farmers’ current N application rates with APSIM forecasts based on deep mineral N sampling. Models like APSIM use a mass balance approach to determine how much fertiliser should be applied to the crop to achieve its potential yield. Paddocks were selected and divided into two sections to demonstrate crop performance using farmer- and model-estimated fertiliser N application rates.
Paddock sections that received model-estimated N rates yielded similar dry matter (DM), slightly greater N use efficiency and the same soil residual N at harvest compared with the paddock sections which used farmer-estimated N rates. Modelled N leaching was negligible on this farm.
Applied N fertiliser, crop yield, N use efficiency and model-predicted N leaching and residual soil N at harvest for demonstration paddock in 2017-18 season. Soil sampling date 10 Aug 2017 for pre-sowing soil mineral N.
| Paddock | Crop | Pre-sowing soil mineral N (kg N/ha) | N rate estimated by | Applied N (kg N/ha) | Yield (t DM/ha) | N use efficiency* | Leaching (kg N/ha) | Residual N (kg N/ha) |
| R12 | Oats | 17.1 | Farmer Model | 140 120 | 9.92 10.3 | 1.35 1.63 | - - | 14.6 14.6 |
An article relating to the SCRUM-APSIM modelling work was published in Agronomy NZ.
A full report on the arable monitor farms, including the detailed results of the catch crop demonstrations on this farm and at Chertsey, and an N fertiliser rate demonstration on another arable monitor farm.
Now’s the perfect time to check in, plan, and set up for a strong season. We’ve pulled together smart tips and tools to help you stay ahead all winter long.
Whether you prefer to read, listen, or download handy guides, we’ve got you covered with trusted tools to support your journey every step of the way.


