logo

Data quality

Topics

3 min read

Contemporary groups Reliability Resilient Dairy Programme Genetic base cow

This page covers the concept of contemporary groups, which are cohorts of cows managed under identical conditions, essential for precise animal evaluations as well as genetic reliability, highlighting the confidence in an animal's breeding worth and breeding values. The page also explains breeding worth, breeding values, and the Resilient Dairy Programme.


Contemporary groups

A contemporary group is a cohort of cows that have had an equal opportunity to perform in their herd.

Animals in a contemporary group are managed with the same feed resources and environmental conditions.

The definition of contemporary groups for NZAEL’s animal evaluations vary slightly by the nature of the trait, but generally a contemporary group reflects animals that are:

  1. in the same herd (e.g. same farm location and herd number)
  2. tested/inspected/weighed on the same day (e.g. herd-tested or TOP inspected)
  3. belonging to the same age group (e.g. 2 year old, 3 year old or 4 year old)
  4. with the same season of calving (e.g. spring or autumn)

For production traits, sampling regime (e.g. twice-a-day or once-a-day) is also considered, which is important given the different herd testing options now available to farmers.

Animal evaluation is not driven by the actual performance of cow, it is driven by the differences in performance between cows that are managed similarly. In other words, how an individual cows performance differs from the average of her contemporary group.

When estimating breeding values, we partition an animal’s performance into differences due to management, climatic or environmental effects in order to obtain reliable estimates of genetic differences (i.e. breeding values) between animals. Using well-defined contemporary groups helps to identify animals that will produce more productive offspring.

If this was not the case, animals who were fed to higher levels, were tested on a day with more favourable weather conditions, under a different calving regime or were at a higher stage of production would seem better candidates to use as parents than they actually are. For example, 6-year-old cows will produce more on average than 2-year-olds, so for the purposes of animal evaluation, it is important to compare all the 6-year-olds from one herd with each other, and to compare all the 2-year-olds from one herd with each other, and not to directly compare the 2-year-olds with the older cows.

If the contemporary groups used in animal evaluation are not a true reflection of cohorts of animals, the evaluation will be suboptimal. If two different cohorts of animals are not properly distinguished into two contemporary groups, the evaluations on those animals, and their ancestors and descendants, will be biased. The evaluations of some animals will be biased upwards and others will be biased downwards.

Reliability

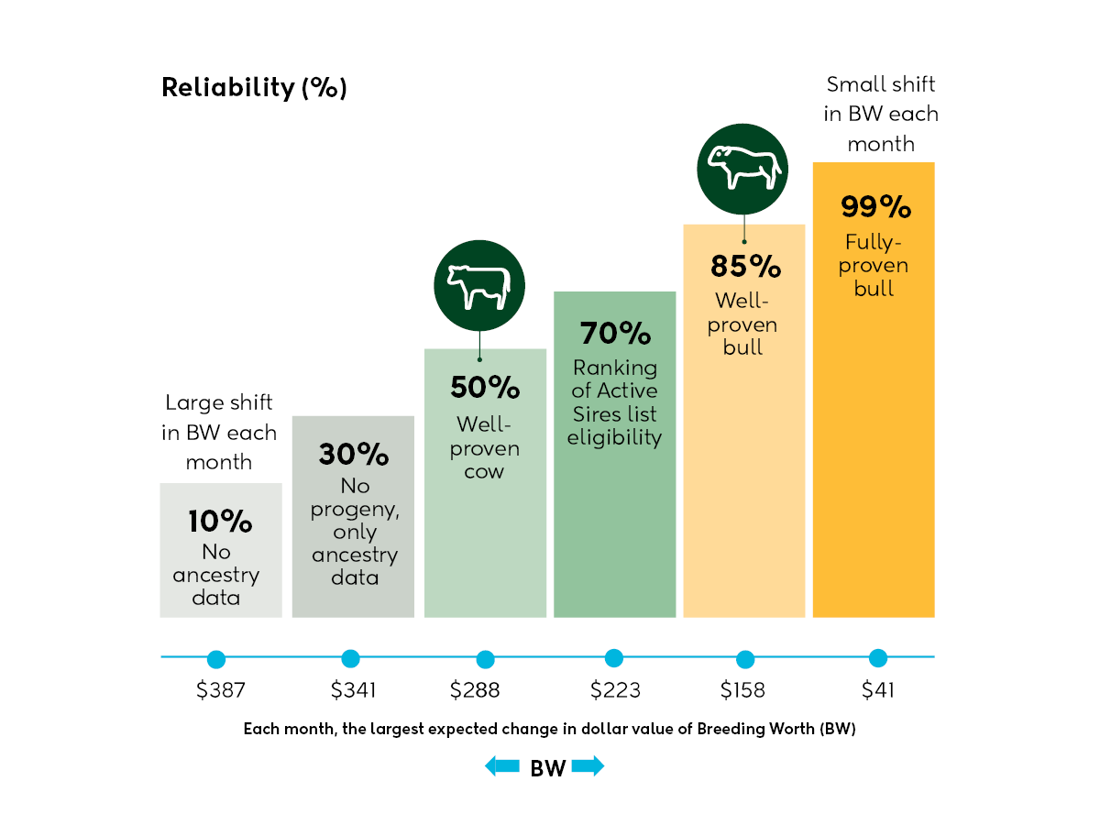
For all traits, reliability is measured on scale of 0 to 100%, and indicates the confidence that an animal’s BW or individual breeding values are a measure of their true merit.

If a bull has no daughters, we rely totally on ancestry information. Once a bull has 70% reliability - about 33 daughters - it is eligible for inclusion in the Ranking of Active Sire (RAS) list. At this time, only about 16% of its BW is based on ancestry information with the rest based on the performance of its daughters in progeny test or commercial herds.

Sires with greater than 10,000 daughters have a reliability of approximately 99%, and BW or individual breeding values are based solely on the performance of their daughters in progeny test or commercial herds. The BW of a bull with no daughters is highly likely to change. The likelihood of an animals BW or individual breeding values changing reduce as more daughters are included in their bull proof.
LIC and CRV include genomic information (as well as progeny test and commercial records) in their reliability estimate for bulls. So, a bull with no daughters but genomic information may have reliability greater than outlined above.

Cows

The reliability of individual cow BW and breeding values works in much the same way as for bulls. But, we cannot obtain 10,000+ daughters so reliability will never be as high for a cow as a widely used bull.

For cows, reliability depends on ancestry, own and progeny information. For a cow with no milk records, we rely totally on ancestry information (green line above) to determine reliability and how we weight the data. Once a cow has a milk record, a small proportion of its BW is based on her own records (orange line). Like a bull, progeny records (red line above) of a cow become progressively more important than her own or ancestry information.
For more detail: Description of Method to Estimate Reliability View PDF (47 kb)

Resilient Dairy Programme

The Resilient dairy programme is a seven year project starting in 2019. The purpose of the resilient dairy programme to increase genetic gain through the use of genomic technology.

Developing information herds within the resilient dairy program - Initial case

Business case for developing information herds within the resilient dairy programme to increase genetic gain through the use of genomic technology.

Genetic Base Cow

Breeding Worth (BW) and Breeding Values (BV) are presented as the difference between an animal’s genetic merit and the average genetic merit of the 'base cows’.

Every year we see genetic improvement in the national herd; which would lead to the average of each successive crop of replacement heifers coming through having a higher Breeding Worth (BW) than the replacement heifers from previous crops.

To keep the comparison to the genetic base relevant, we routinely update the definition of the base to represent a younger group of cows. As a rule of thumb, the genetic base cow in NZ represents cows from between 10 to 15 years ago. BWs and BVs represent the genetic superiority of an individual animal compared to this base.

How An Animal Compares To The Genetic Base Cow 2022

The current group of cows that define the 'genetic base' consists of 21,584 well-recorded cows born in the year 2005 with the following breed breakdown:

Holstein-Friesian

6,617 cows; 31% of cows

Jersey

4,915; 23%

Ayrshire

763; 4%

HF x J

7,917; 37%

Other

1,372; 6%

The same group of cows is used to define the base for all the traits. This group of cows defines the base because they had been scored for Traits Other than Production (TOP) as well as having multiple herd test records in their first, second, third and fourth lactations. Since poor performing cows are culled each year, the cows that define the base represent an above-average cohort of cows from the base year.

The performance of the base cows is dictated by their genetic merit in addition to the way they were managed. Comparing the actual performance of base cows to other animals will not provide insight into the genetic merit of the other animals. The best way to compare the merit of some other group of animals to the base cows is to inspect the BVs and BWs of the other group of animals.

Nevertheless, the average productivity of the base cows is sometimes sought for other reasons, such as for economic models. Accordingly, their mean performance is detailed below.

Milk production averages - assumed 270-day lactation
Lactation Fat Yield (kg) Protein Yield (kg) Milk Volume (L) Number of cows
First 178 139 3,768 21,565
Second 213 170 4,508 20,973
Third 232 187 4,922 20,768
Fourth-sixth 245 198 5,266 21,339

Somatic cell

To estimate breeding values for somatic cell, the somatic cell count (SCC) is 'log-transformed' to a somatic cell score (SCS). This is a computing trick to enable us to get the most accurate breeding values for somatic cell, otherwise, a few very large values could unfairly bias the calculations. For this reason, we have provided the average SCS as well as the median SCC. Much like when reporting house prices or household incomes, the median is a more robust measure for summarising somatic cell, where a few very high values could otherwise skew the average.

Lactation Average SC score Median SC count
First 6.0 54
Second 6.0 56
Third 6.2 67

Fertility and functional survival

Genetic base cows were selected if they had herd test records in at least their first four lactations. As such, they had to have been successful at calving in each of those first four years. Their average performance for fertility and functional survival have been calculated here but should not be used for benchmarking cow or herd performance due to the way the base cows are selected.

Calving period Calving season day (CSD) Calving within 42 days
of PSC (CR42)

Presented for mating within
21 days of PSM (PM21)

Functional Survival
First 22 88% 100%
Second 31 74% 83% 100%
Third 32 71% 77% 100%
Fourth 31 74% 79% 94%

Liveweight and Body Condition Score

Historically, very few dairy cattle were weighed as mature cows. For this reason, we have published the average liveweight of the genetic base cows at 2 years of age (n=12,701). We do not recommend that this average is used to forecast or benchmark cow or herd performance for the following reasons:

  • The base cows were born in 2005 and were not necessarily grown according to present day industry standards.
  • Liveweight breeding values in NZ represent mature weight, and so they are on a different scale to this genetic base cow average.

Please work with your farm consultant to determine the appropriate liveweight benchmarks and/or targets for your herd.

Trait Liveweight (kg) Body Condition Score Days in milk when weighed/scored
Two-year-old 376.5 4.1 85

Traits Other than Production (TOP)

Genetic base cows were scored for TOP when they were on average 86 days since calving. Their average scores are as follows:

Udder conformation Average Score
Udder support 6.0
Front udder 5.7
Rear udder 5.8
Front teat 4.5
Rear teat 5.8
Udder overall 5.7
Teat length* Assumed 4.2

*In December 2021, we began publishing the Teat Length breeding value using records from cows scored since 2017. The genetic base cows born in 2005 were recorded for TOP traits in their 1st lactation in 2007 before teat length was included in the suite of TOP traits. As an approximation of what the base cows might have been, the average teat length score of cows with a teat length breeding value near zero was 4.2.

Body conformation Average Score
Stature 5.7
Capacity 6.3
Rump angle 4.8
Rump width 6.2
Legs 6.2
Dairy conformation 6.4
Farmer opinion Average Score
Adaptability 6.1
Shed temperament 6.3
Milking speed 6.3
Overall opinion 6.6

The last genetic base cow update was introduced in 2016 and a subsequent update has since been postponed due to the changes in the genetic evaluation that have occurred in the last few years.

It is important to note that a change to the genetic base does not cause any re-ranking among bulls, cows, herds or breeds. It merely shifts all animals up or down equally depending on the genetic base that is chosen.


Last updated: Feb 2024
Share:
Tags related to “Data quality”

Related content

Breeding Worth

Animal

24 min read

Breeding Values

Animal

5 min read

Economic Values

Animal

4 min read

Genomics

Animal

2 min read

Inbreeding

Animal

3 min read