Budgeting, Medium Input (Canterbury)
Topics
15 min read
Camden Dairy Farm is in Bankside, 9 km from Dunsandel. The farm is part of the Camden group whose stakeholders strive to strive to operate a profitable, sustainable and resilient business, which is able to identify major risks to the business and utilise tools to mitigate and manage these risks.
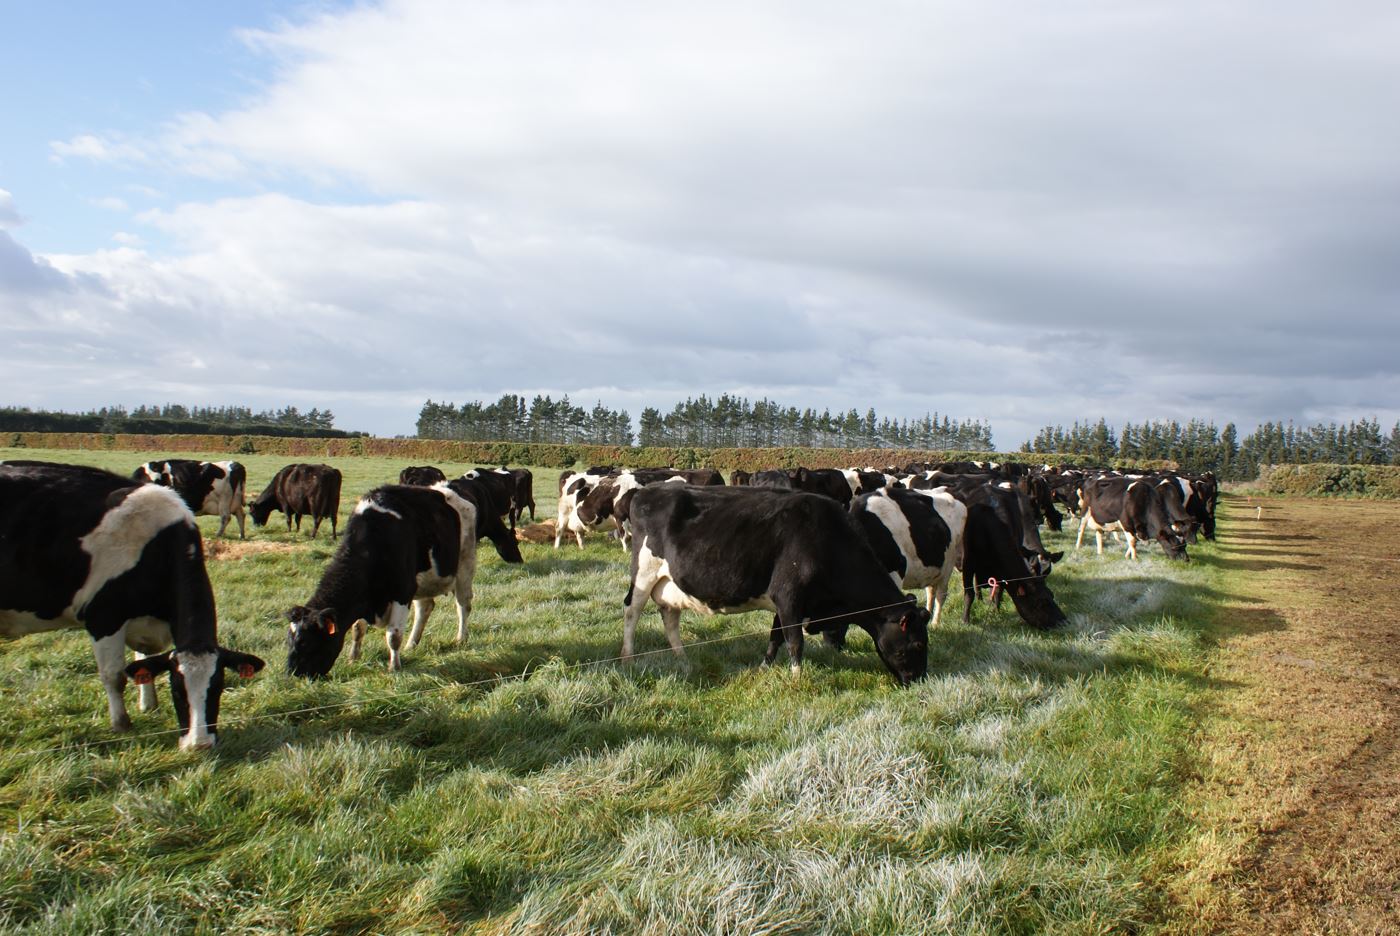
The farm has a 214 effective ha milking platform milking 780 kiwi cross cows, running a medium input feed system. Pasture management and feed budgeting are a priority and key to ensuring efficient use of feed and consistent milk production.
Camden Group operates across Canterbury, and is owner/operator of 4 irrigated dairy platforms as well as ownership and investment in irrigated dairy support farms. They are also equity partners in farms in mid and South Canterbury.
Camden Group dairy support farms, provide all young stock and winter cow grazing and silage requirements. All transactions between the dairy farm and the support farms are at market rates.
The aim of the business is to exceed best practice standards with regard to employment, animal welfare, compliance and the environment.
The stakeholders strive to operate a profitable, sustainable and resilient business, which is able to identify major risks to the business and utilise tools to mitigate and manage these risks.


Business type:
Owner Operator
Location:
Bankside, Selwyn District, Canterbury
Farm size:
214 ha effective milking platform,
Land:
100% irrigated (Water source is 3 x 300mm bores)
Soil Type:
Eyre Stony Silt Loam
Peak cows:
755 Kiwi cross
PSC:
1/08/2025
Stocking rate:
3.5 cows/ha
Farm system:
3 (11-20% feed imported)
Wintering system:
100% of the herd wintered off farm for 9 weeks
Production:
360,000 kg MS/year, 1,682 kg MS/ha, 477 kg MS/cow, budgeted
Production (3 year average):
360,215
| Financial KPI 2025-26 Budget | |||
| Net dairy cash income ($/kgMS) |
Total farm working expenses ($/kgMS) |
Total operating expenses ($/kgMS) |
Dairy operating profit ($/ha) |
| $11.92 | $5.23 | $5.92 | $10,242 |
| Physical KPI 2024-25 est | |||
| Pasture and crop harvested (t DM/ha) |
Purchased N surplus (kg N/ha/yr) |
GHG (t CO2 equiv/ha/yr) |
Six week in-calf rate (%) |
| 15.7 | 105 | 15.3 | 73 |
Find out more about these KPI's and how to calculate them for your own farm here.
Key points
Strategy and financial
Mission
To create a financially secure group of businesses that allows all participants to thrive – and continues to sustainably serve communities for generations to come.
"The Camden Way"
Management
The farm operation is supported by Camden Group Services, a business services group which support all six farms. This includes farm management oversight and administration and financial management, the cost of which is charged to Camden Dairy at market rates.
Budgeting
Budgeting is drafted by the Camden Group Services team in consultation with Farm Managers and 2ICs and is approved by the Directors prior to the start of each season. The budget is monitored and reviewed frequently using an online farm accounting software package and budget v actual variance reports. The budget is updated in more detail for quarterly board meetings, so an accurate forecast of the year-end view is established. This gives the Board the ability to plan ahead in making decisions on dividends and future capital expenditure
Co-operative difference
Since the 2021-22 season the farm has achieved the standards required to receive a Fonterra Co-operative difference of up to 9.8 cents/kg MS. This is above the company average. Undertaking the work needed for this has been beneficial for the farm and farm staff as it has helped to show what “good” looks like.
Networking
Camden Group management value the benefits gained from being involved in community and industry projects and networking with their peers.
Farm policy and infrastructure
The farm is well subdivided, (33 paddocks 6.0.9.0 ha each, 2 wire electric fencing), with good internal laneways.
An independent stock water well and reticulation system provides all stock water. There are two 1,300 litre troughs in each paddock. A dosatron inline dispense is installed for delivery of minerals.
The farm has minimal machinery, and a plant replacement policy that includes turnover of bikes at 15,000 km. This keeps R & M costs low but does have a higher capital cost.
The aim is to winter 780 cows and in calf heifers, all off farm on Camden group owned support blocks.
All young stock are grazed off farm, with weaners off farm by 1st December.
Pasture management and feed budgeting are given priority. Farm cover is measured and feed budgets updated weekly for 9 months of the year.
Spring Rotation Planner is followed from 1 Aug, to balance date around 25th Sep, on a 24 day round from there until 1 March, then an autumn planner is used.
Spring surpluses are managed with planned regrassing program, (12-15% /year permanent pasture), & silage made if there is an unmanageable surplus. Quality is king, correct round length is vital with the aim to fully feed cows 100% of the time. Post grazing residual 1500-1600 KgDM/ha is the aim.
Achieving recommended cow condition and pasture cover targets for the farm at key times are critical, and decisions for culling and drying off are based on feed budgets, cow condition scores and calving dates
Feed
Herd
People, health and safety
Environment


The analysis found that across about 302,000 hectares of dairy production land, the mean nitrogen loss per hectare in 2016-17 was 63.8 kg per hectare. This had reduced to 46.2 kg per hectare in 2021-22.
Budget updated June 2025
| INCOME | $TOTAL | $/KgMS | $/COW | $/HA |
| Net Milk Sales
The milk revenue is based on 360,000 kg MS @ $9.50/kgMS advance, to April 2026 received May 2026, (based the Fonterra forecast of $8-11/kgMS for the season as at 29-5-2025), and 371,415 kg MS @ $1.35 deferred, (including May 25 milk payments received in June). The deferred milk payment is net of the fee for fixing and the adjustment for retro fixed milk of $0.67/kgMS over 70,000kg MS i.e. the difference between $9.23 fixed and $9.90 FGMP. The Fonterra dividend is $0.40/share in October and $0.20/share in April on 314,000 shares . A Fonterra co-operative difference of $0.098/kg MS on 371,415 kgMS from 24-25 season is also included. This is net of the DairyNZ levy of $.042/kgMS.**This milk income is the farmers best estimate of their likely net milk sales. It may or may not be out of date based on new information from dairy companies. It does not necessarily reflect DairyNZs milk price forecast.
|
3,659,947 | 10.16 | 4,848 | 17,103 |
| Net Dairy Livestock Sales
Net stock income is based on approximately 480-490 bobby calves @ $25-30/hd, 20-25 live calf sales at $100/hd, 165 MA surplus, carry over and cull cows @ $800/hd and 7 R 2 heifers @ $600/hd. The plan is to purchase about 20 MA in calf cows from Camden Group, (CG), and 20 in calf R 2 heifers from the support/dry stock enterpris. The average price will be about $1,600/head for the cows adn $1,900/head for heifers.
|
162,500 | 0.45 | 215 | 760 |
| Other Dairy Cash Income | 0 | 0.00 | 0 | 0 |
| NET DAIRY CASH INCOME | 3,822,447 | 10.61 | 5,063 | 17,862 |
Non-cash adjustments have been included below the cash analysis to enable fairer comparisons to be made between farms. These adjustments are not part of a cash budget but are important to fully understand the efficiency of the farm business.
| EXPENSES | $TOTAL | $/KgMS | $/COW | $/HA |
| Wages(incl. ACC)
The farm operation employs 4.5 FTE, made up of one farm manager, one 2IC, two senior farm staff, plus a seasonal worker from mid-July until January, to cover calving, calf rearing, mating and annual leave commitments. This is net of employee accommodation allowances and includes employee ACC and a contingency of about $7,000.
|
381,400 | 1.06 | 505 | 1,782 |
| Animal health
The approach to animal health is to be vigilant, keep good records and be proactive. Metabolic diseases are not an issue as supplementation can be made easily through the metered in line water dispenser. The average bulk somatic cell count for the herd is below 130,000. The animal health budget includes dry cow therapy for the herd, and teat sealing, (including the in calf heifers). This accounts for about 1/4 to 1/3 of the total animal health budget. The incidence of lameness varies, (3-8% of the herd), but is mostly treated in house so is not a large direct cost. Laminitis can occur in December/January with the change in feed quality.
|
64,900 | 0.18 | 86 | 303 |
| Breeding and herd improvement
Mating is for 9.5 weeks, AI is used for the first 5 weeks, made up of 3 weeks using 60% premier sires, 20% sexed semen and 20% beef semen, (for lower genetic merit cows). Weeks 4 and 5 ares with compact calving “dairy” semen. 40 Jersey bulls are leased for $600/hd including grazing and freight. Some, (about 20), are used with the heifers, and the balance are used with the herd for the last 4.5 weeks of mating and are removed from the herd 27th December. Pregnancy testing is carried out at 35 days after mating has finished. A second pregnancy is done late April/early May to identify any final empties. There is no anoestorus or synchrony treatments used. Herd testing is carried out 4 times a year with 2 tests over two milking and two tests from one milking. Includes protrack subscription.
|
67,000 | 0.19 | 89 | 313 |
| Farm dairy
Standard dairy plant cleaning and maintenance is followed.
|
24,200 | 0.07 | 32 | 113 |
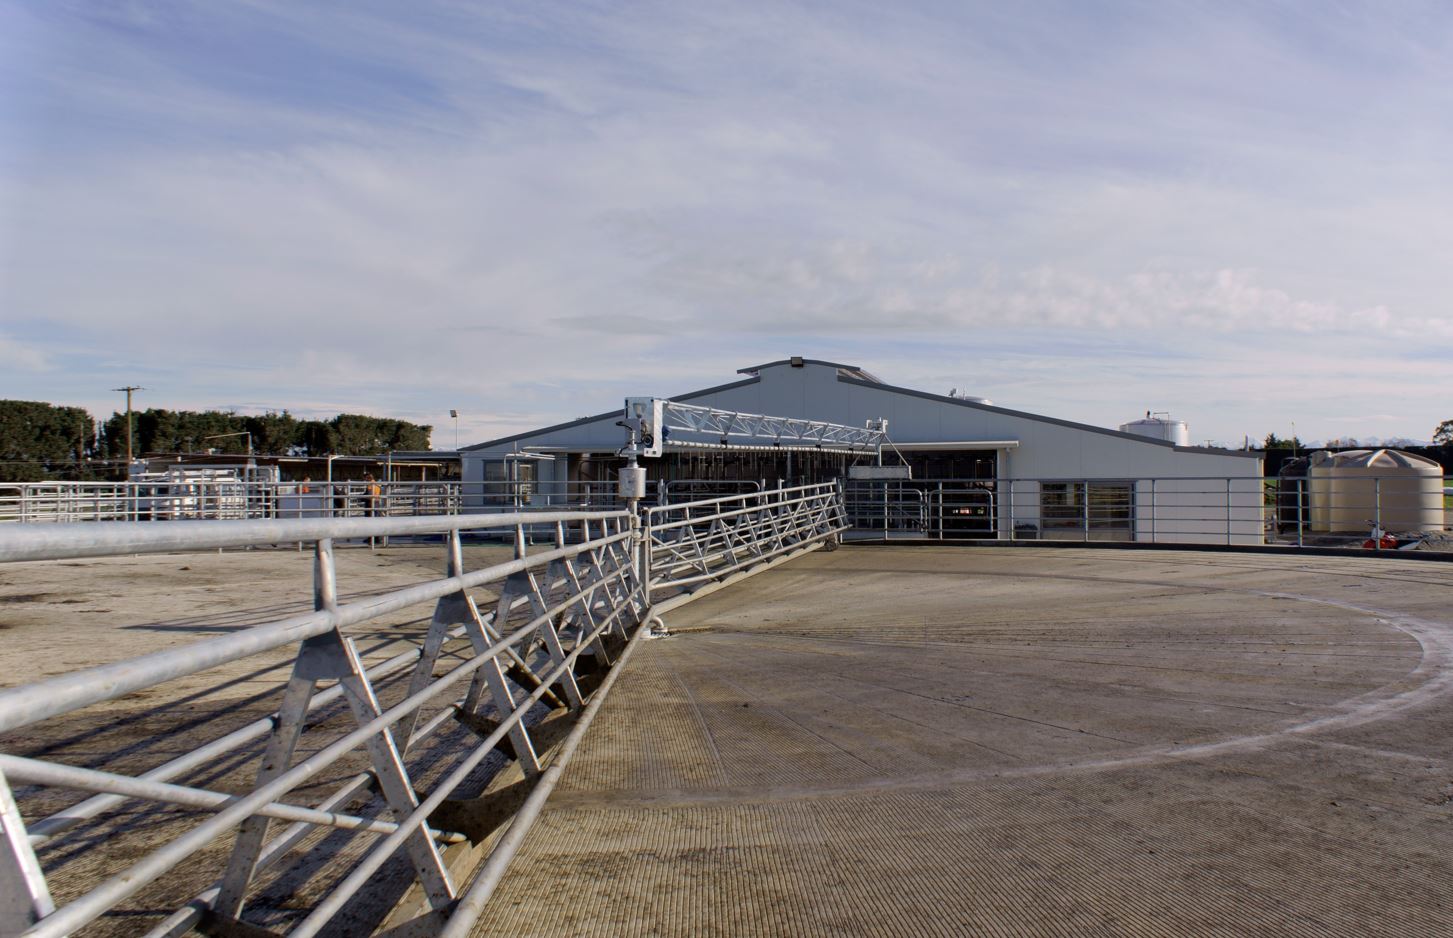
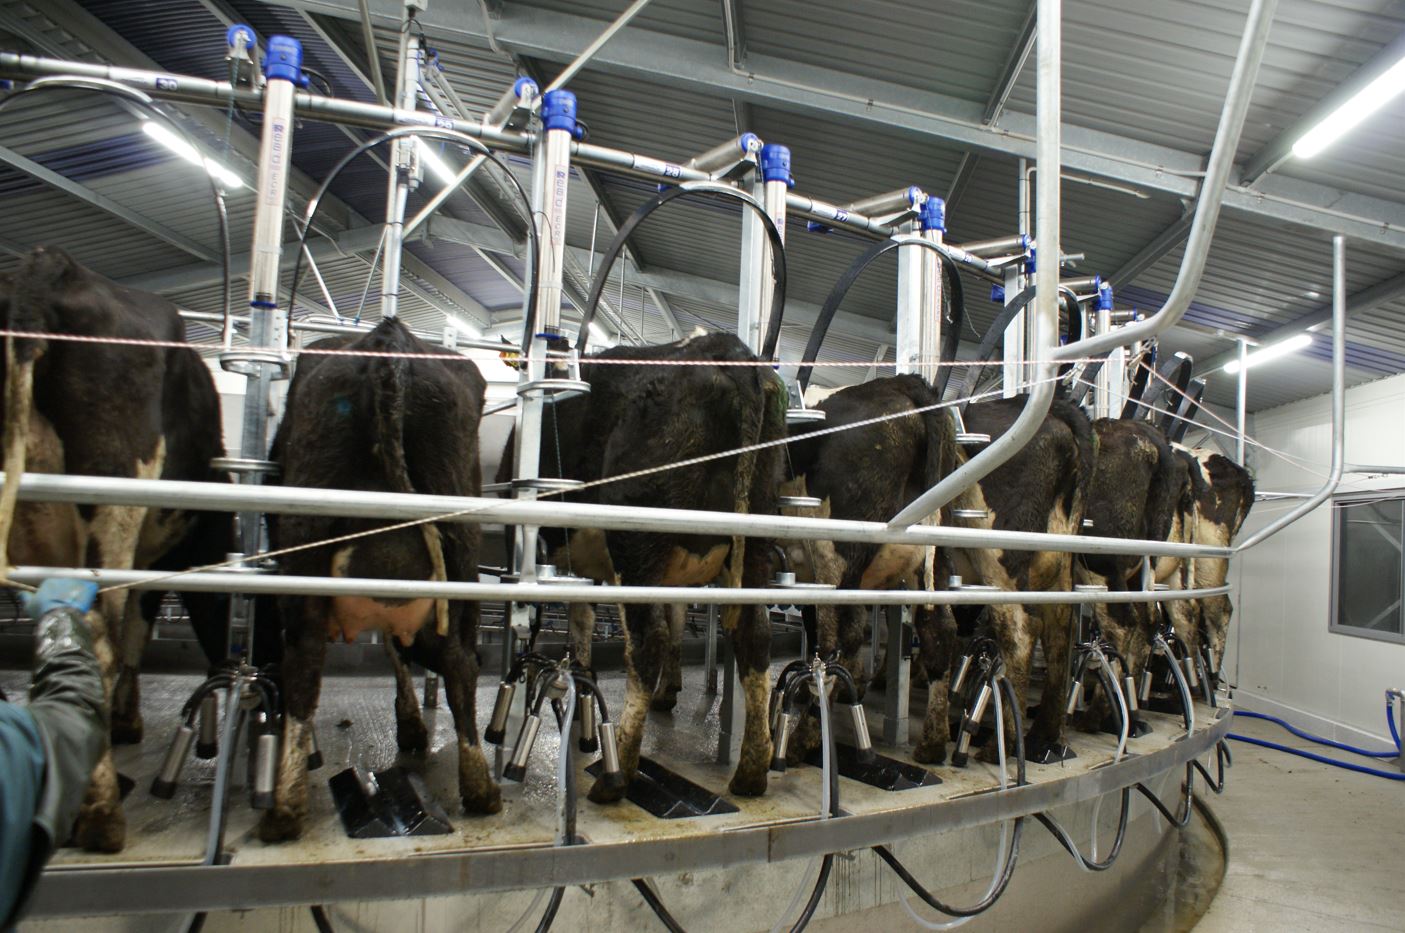
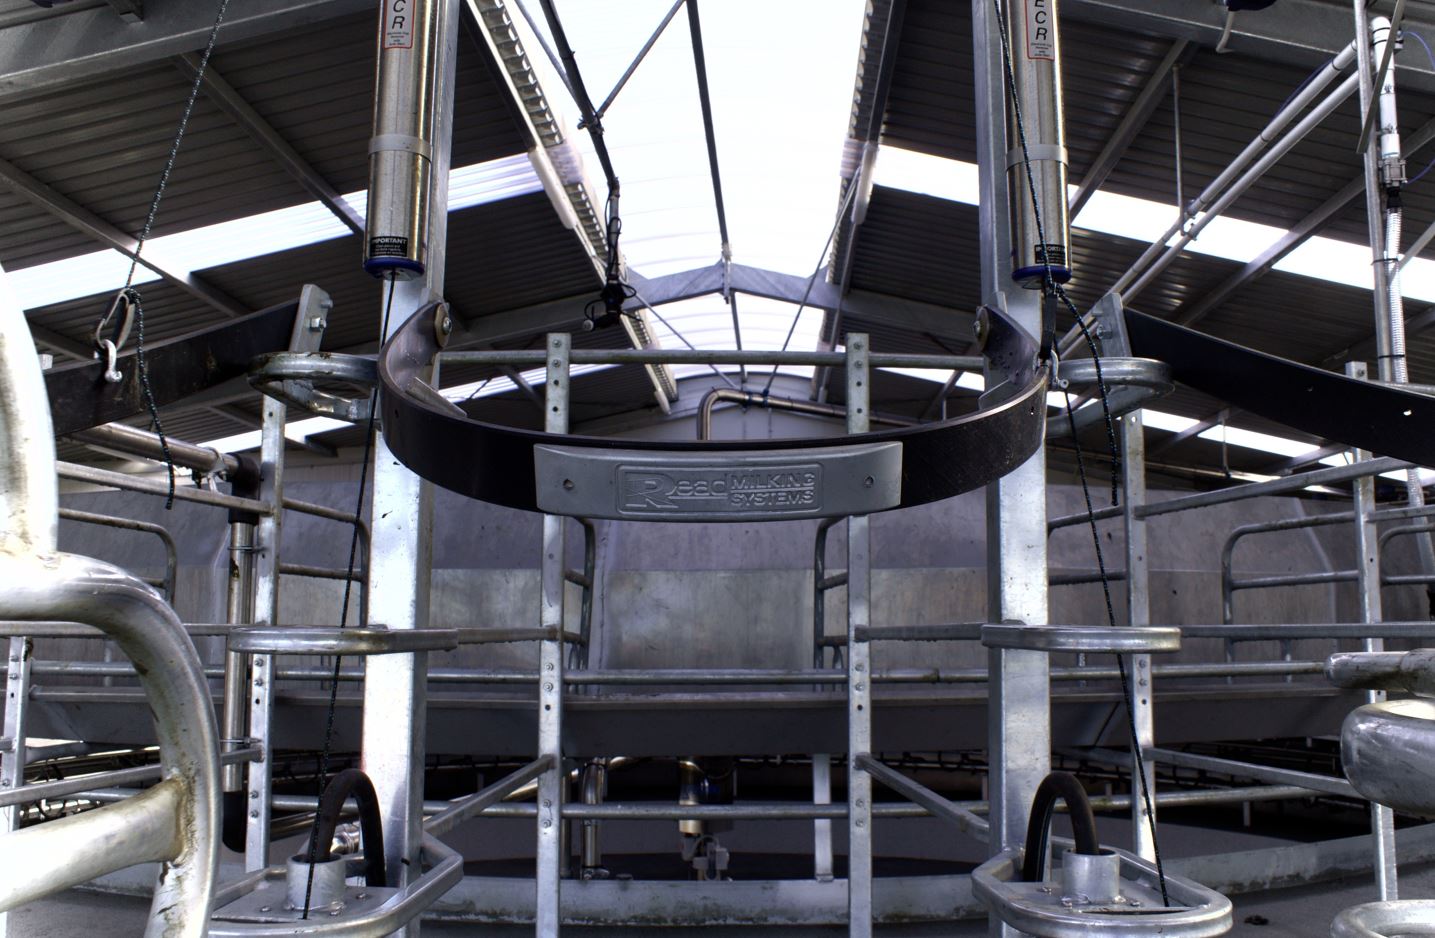
| Electricity(farm dairy, water supply)
The dairy shed is a 54 bail rotary shed turnstile, (built in 2020).
|
15,000 | 0.04 | 20 | 70 |
| Supplements made(incl. Contractors)
Usually no supplement is made on the milking area. The plan is to have sufficient cow numbers to harvest all the pasture.
|
0 | 0.00 | 0 | 00 |
| Supplements purchased
Most hay and silage purchases are sourced “in house” from within the Camden Group at market rates. About 750 kg DM/cow will be purchased for the 2025-26 season; 600kgDM/cow of baleage @ $0.45/kg DM and 150 kg DM/cow of proliq @ $0.18/kg DM.
|
231,700 | 0.64 | 307 | 1,083 |
| Calf rearing
About 185 replacement heifer calves are reared each year, on whole milk, meal, pasture and hay. They are weaned off milk at 70 kg liveweight, (LW), and continue to get crushed barley and fresh pasture until they reach 100 kg LW. Up to 1.5 t of milk powder may be used each year to top up the fresh milk supply.
|
30,000 | 0.08 | 40 | 140 |
| Young and drystock grazing
160 heifers @ $17.50/head/week for 52 Weeks and 185 weaners from December to May 1st @ $11.00/week. Per head price includes freight and animal health costs.
|
189,200 | 0.53 | 251 | 884 |
| Winter grazing
The herd is grazed off on average for 9-10 weeks @$35/hd/week. This includes grazing for carry overs, plus transport.
|
263,600 | 0.73 | 349 | 1,232 |
| Fertiliser(incl. N)
Fertiliser applied each year are based on soil tests and nutrient budgets.
Nutrients applied vary : Phosphate 25-30 kg/ha Potash 0-5kg/ha and Sulphate Sulphur 55-65 kg/ha. Nitrogen use is 180-190 kg of N/ha usually applied at 22.5 kg/N/ha over 8 applications. Product used is Ammonium sulphate for the first application, then urea, with N protect used during hotter weather or when there might be a delay between application and irrigation.
|
130,000 | 0.36 | 172 | 607 |
| Irrigation
Moisture and evapotranspiration levels are monitored on farm, and water use is budgeted. This information is used in daily irrigation planning to ensure costs are kept down and the irrigation carried out is effective. The water source is from 3 bores so cost is for electricity only. Consent is for 134l/sec or 5mm/ha/day, however with efficient irrigators and moisture monitoring this level of take is seldom reached.
|
143,400 | 0.40 | 190 | 670 |
| Regrassing & cropping
This season the plan is for 5.84 ha of fodder beet. The crop will be planted in spring 2025 for a cost of $3,000/ha.
The current regrassing plan is for 33 ha of regrassing, made up of 27 ha of pasture sown grass to grass with a perennial ryegrass/white clover mix, and 5.84 ha of last winters crop returned to permanent pasture. The cost of regrassing is about $1,100/ha. All regrassing is done in September and is usually back in the grazing rotation by late December.
|
52,300 | 0.15 | 69 | 244 |
| Weed and pest | 4,000 | 0.01 | 5 | 19 |
| Vehicles & fuel
The farm has minimal machinery, and a plant replacement policy that includes turnover of bikes at 15,000 km. This keeps R and M costs low but does have a higher capital cost. Includes $16,000 for fuel.
|
32,000 | 0.09 | 42 | 150 |
| R&M (land, buildings, plant, machinery)
Includes $14,000 for irrigation equipment repairs and pivot rut remediation, $25,000 building repairs, $10,000 drains and effluent, $5,000 plant and $3,000 shelter trees.
|
64,000 | 0.18 | 85 | 299 |
| Freight and general farm expenses
Includes bio-security levy of $2,900 plus costs for dead cow disposal and waste disposal.
|
8,900 | 0.02 | 12 | 42 |
| Administration
Includes environmental compliance and irrigation consent monitoring, plus $120,000 for Willsdens share of Camden group services business overheads. This is up nearly 10% on previous years due to rising labour costs.
|
126,100 | 0.35 | 167 | 589 |
| Insurance
As per last invoice plus allowance for additions.
|
41,600 | 0.12 | 55 | 194 |
| Rates
Have budgeted for an increase on last season.
|
16,700 | 0.05 | 22 | 78 |
| TOTAL FARM WORKING EXPENSES | 1,882,645 | 5.23 | 2,494 | 8,797 |
| CASH OPERATING SURPLUS | 2,408,819 | 6.69 | 3,190 | 11,256 |
| NON-CASH ADJUSTMENTS | $TOTAL | $/KgMS | $/COW | $/HA |
| Value of change in Dairy livestock
Anticipating that there will be 25 more R 1 heifers, 2 less R 2 heifers and 4 more MA cows on hand at the end of the season. These changes in numbers are valued at the IRD 2025 NAMV.
|
29,967 | 0.08 | 40 | 140 |
| Labour adjustment
All owner input is covered by the share of Camden group service business fee.
|
0 | 0.00 | 0 | 0 |
| Feed inventory adjustment
Expect to have about 37-38 t DM less on hand at the end of the season.
|
-16,987 | -0.05 | -22 | -79 |
| Owned support block adjustment | 0 | 0.00 | 0 | 0 |
| Depreciation
This is as per accountants estimated for the financial statements for the 24-25 season, plus allowance for one more year of depreciation plus allowing for asset accumulation/sales.
|
230,000 | 0.64 | 305 | 1,075 |
| DAIRY GROSS FARM REVENUE | 3,962,400 | 11.01 | 5,248 | 18,516 |
| DAIRY OPERATING EXPENSES | 2,156,120 | 5.99 | 2,856 | 10,075 |
| DAIRY OPERATING PROFIT | 1,806,280 | 5.02 | 2,392 | 8,441 |
Want to see how the top operators are spending their money? Are there areas for improvement in your own business where savings can be made? We’ve collected in-depth current season budgets from a number of top performing farms with a focus on lower ‘per unit’ cost of production to help you identify opportunities.
Now’s the perfect time to check in, plan, and set up for a strong season. We’ve pulled together smart tips and tools to help you stay ahead all winter long.
Whether you prefer to read, listen, or download handy guides, we’ve got you covered with trusted tools to support your journey every step of the way.
Put our proven strategies and seasonal tools to work. Boost production, support animal health and watch your profits hum.
Tools that are backed by science, shaped by farmers and made for this season.
That’s Summer Smarts.
Autumn Smarts brings together the research-backed tools that build resilience and boost performance.


