Budgeting, Rachel and Kenneth Short (Taranaki)
Topics
24 min read
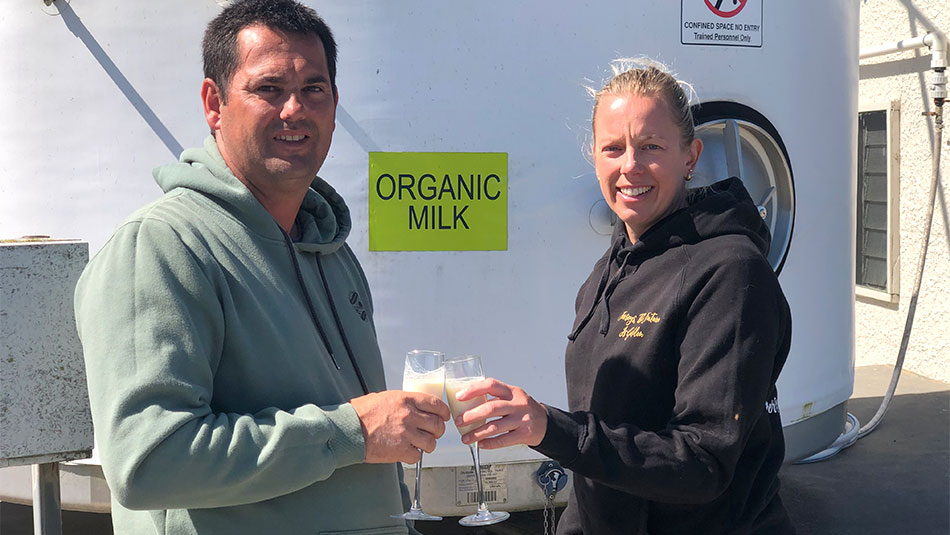
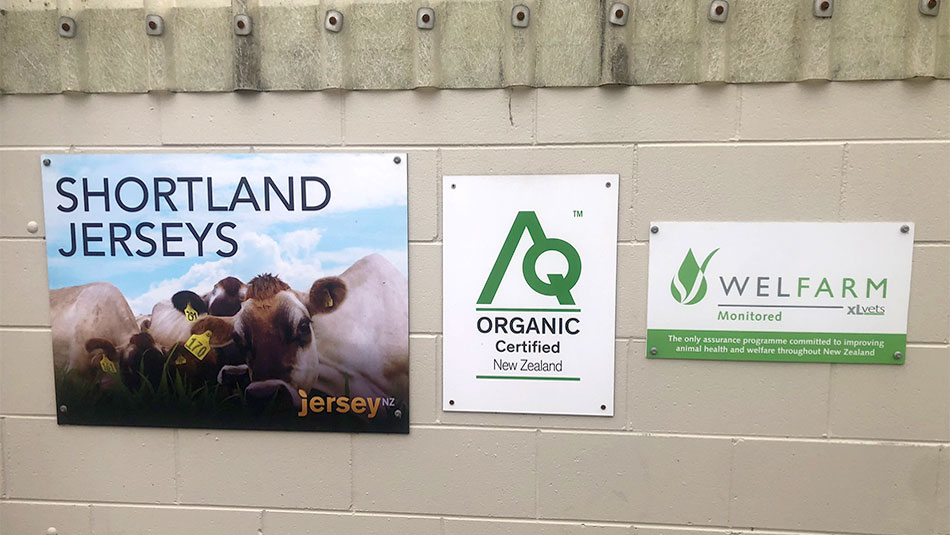
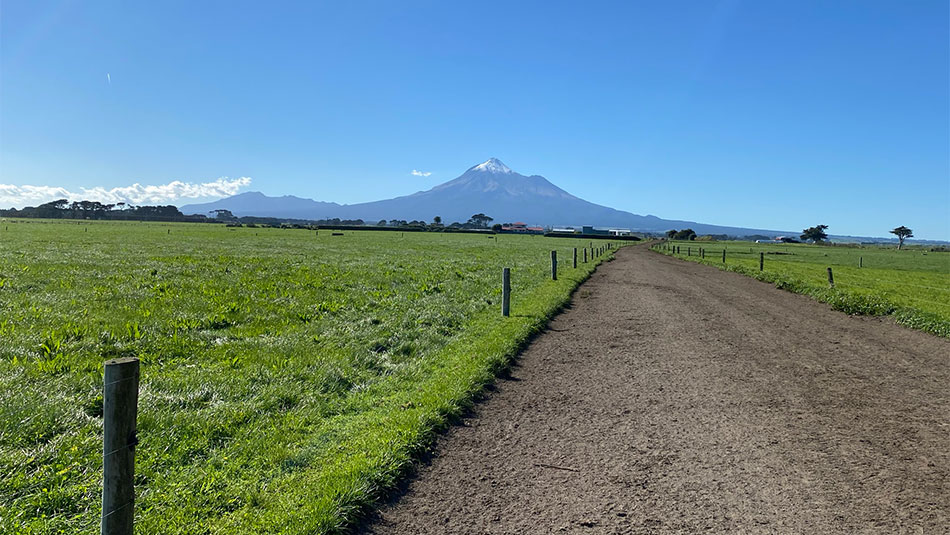
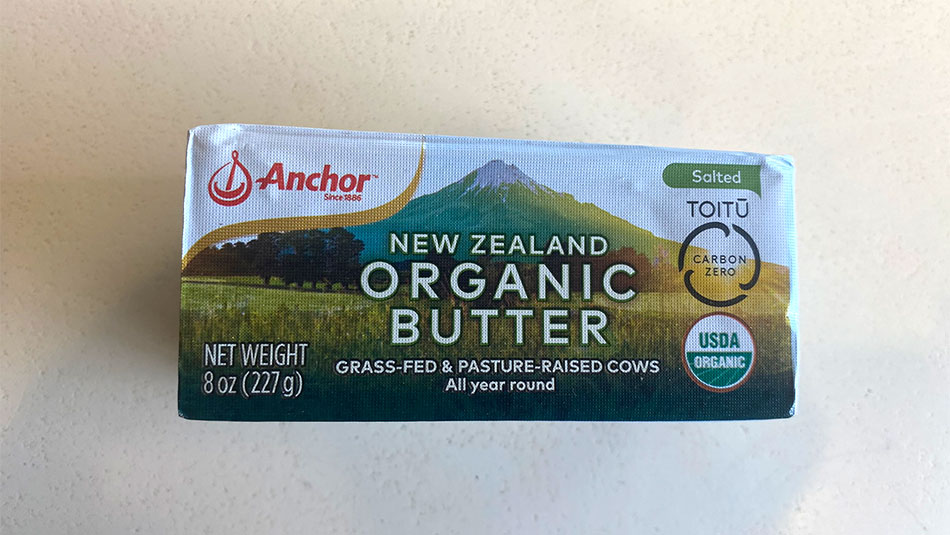
Rachel and Kenneth Short own a 168 ha self-contained, organic farm in Coastal South Taranaki, milking 350 Jersey cows and grazing all young stock. In addition to all their own stock another 50-55 yearlings are grazed for their second organic farm. Their mission is sustainable, profitable production of specialty milk while minimising environmental harm. Regenerative pasture and soil management are a key part of their farm management plan. They introduced Halter technology in 2022, which adds about $0.45-0.55/kgMS to their farm working expenses.
In the video below, Rachel and Kenneth reflect on how their season is tracking within an organic dairy system, and the decisions they’ve made to keep the business moving forward. They also share how they’re using Halter technology to support pasture and livestock management, alongside maintaining performance and managing risk through the second half of the season.

Video highlights:
Business type:
Owner-operator, organic
Location:
Coastal South Taranaki
Farm size:
168 ha effective with all young stock on farm, plus 54 yearlings from second organic farm
Peak cows:
340-350 Jersey
PSC:
20/07/2025 MA cows
Stocking rate:
2.1 cows/ha (3 cow equivalents/ha with weaners and and all R2 heifers)
Farm system:
1 (no imported feed)
Production:
115,000 kgMS/year, 338kg MS/cow, 685 kgMS/ha (budgeted for 2025-26).
Rachel and Kenneth Shorts' self-contained, very low input, organic, coastal Taranaki farm is embracing regenerative pasture management practices. The business focus is on sustainability and profitable production of high-quality specialty milk with a low environmental footprint.
They are motivated to make the most out of a self-contained system with decisions made accordingly to manage the resources and pasture grown for each season.
This is their third full season with Halter technology which equates to about $0.45-0.55/kg MS. Grazing income from the heifers from their second farm is about $0.30/kg MS.
2025-26 is their first season employing contract milkers. This should allow for time to become more involved in off farm dairy industry initiatives.


| Financial KPI 2025-26 budget updated May 2025 |
|||
| Net dairy cash income ($/kgMS) |
Total farm working expenses ($/kgMS) |
Total operating expenses ($/kgMS) |
Dairy operating profit ($/ha) |
| $13.06 | $4,79 | $5.40 | $5,388 |
| Physical KPI 2-year average | |||
| Pasture and crop harvested (t DM/ha) |
Purchased N surplus (kg N/ha/yr) |
GHG (t CO2 equiv/ha/yr) |
Six week in-calf rate (%) |
| 10.7 | -38 | 6 | 62 |
Find out more about these KPI's and how to calculate them for your own farm here
Strategy and financial
Environment
Farm status
The approach is to have a certified organic farming system that is sustainable and enhances soils, pasture and livestock. There are no compliance issues, and the number of international organic audits done in a season strengthens the ability to market the farms' product.
Farm environment plan
The farm environment plan was completed in the autumn of 2021. There are no actions required with the last of the required riparian planting being completed in 2021-22.The farm has had a tree planting plan done in 2022-23 to provide guidance for all future plantings. The plan will be enacted over several years, but will provide more shade, shelter and food for the stock.
Water use
There is a strong awareness of the value of water. Peak daily use is 35 litres of water/cow in the cowshed. There is a focus on minimising water consumption.
Soil testing, soil fertility and N applied
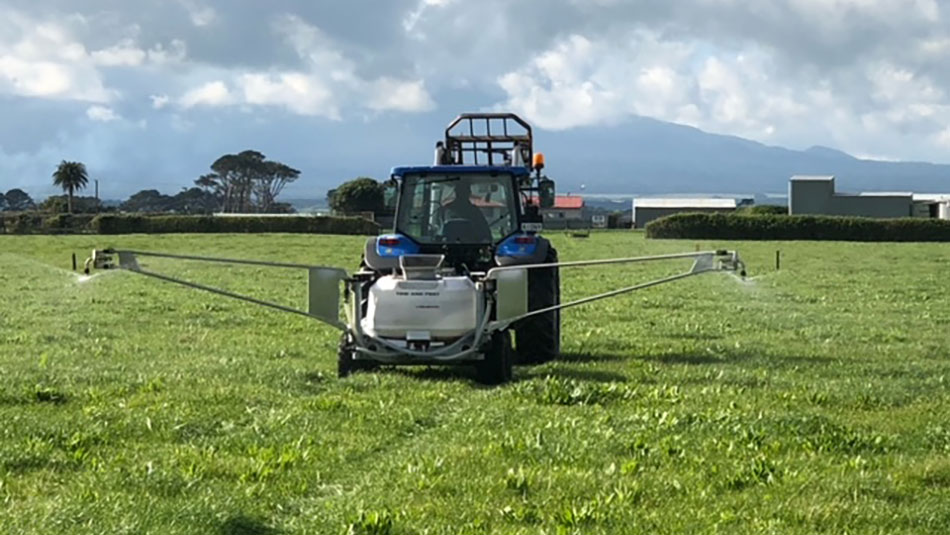
The farm is using biological fertilisers to help unlock the nutrients that are already available in the system by applying fish & seaweed fertiliser.Typically the N,P,K,S percentages of these fertilisers are 2.2%N, 1.55%P, 0.28%K and 0.18%S. The farm currently applies 2 passes of the liquid fertiliser per season meaning a small amount of N & P are applied during those times but the main idea to provide organisms a feed source. All liquid fertiliser is spread using own machinery and weather forecast is monitored before applying.
Improvements in topsoil structure and worm populations were already being observed just six months after changing to biological fertilisers and mixed pasture species.
There has also been less ponding and pasture loss following heavy rainfall in the winter and spring with the improved soil structure.
Soil testing is carried out every 2-3 years to monitor the soil fertility status and compare with pre organic levels. Soil tests being done are both traditional and those that evaluate the soil microbial health.
Shelter and riparian planting
100% of waterways are fenced. Extending areas of riparian planting and of shelter belts is ongoing. Maintenance of existing plantings includes manual release of trees and shrubs and replacing plantings that are lost to flooding or pests, (mainly rabbits).
Farm policy and infrastructure
Feed
Herd
People, health and safety
Budget revision following milk payout drop August 2023
Overview
August 15th, 2023
The forecast milk price for Fonterra Organic farmers has not been lowered yet. By July 2023, organic suppliers were advised the contracted sales for organic milk products for the 23-24 season were already up on last year so this has probably cushioned the immediate impact of the latest GDT figures. At this stage little has changed in our budget for the following reasons:
What advice would you give to farmers who are either first time sharemilking or farm owners?
Keep up to date with your cash flow information and maintain good communication with your bank, accountant, and key suppliers of goods and services, so there are no surprises and any issues can be dealt with proactively.
The focus, as always, is to try to use resources as efficiently as possible and minimise waste.
Ensure pasture grown is fully utilised.
What words of positivity would you give to farmers planning for the coming months ahead?
The industry has gone through these troughs before and will rebound.
Many are in the same boat, so look out for each other.
Do you have any tips and tricks for looking after your people on farm?
It is not just affecting farmers but also those who service the rural communities. You will need them in the long term so good communication and continued support are important.
Strategy for managing a dry summer
October 20th, 2023
How has the season been so far?
What are cash flow forecasts looking like? How will a drought impact this?
Has the NIWA El Nino forecast changed how you are approaching this summer?
Not really. The NIWA forecast for our area for the next couple of months is still for normal rainfall. That said, we always have dry summer strategies in our overall farm plan.
What strategies do you have this season for when a drought comes early, late, or is prolonged?
Budget updated May 2025
| INCOME | $TOTAL | $/KgMS | $/COW | $/HA |
| Net Milk Sales
Milk revenue is based on 115000 kg MS @ an advance price of $10.35/kg MS, 91,395 kg MS @ a deferred price of $1.50/kg MS and a Fonterra dividend of $0.66/share on 130,000 shares. The milk prices used are as per Fonterra notification late May 2024 for Organic farm supply and are May paid June prices, (this farms financial year is 1 July to 30 June). Includes the Co-operative difference of 5-8 c/kg MS. This is net of the DairyNZ levy, (4.2 c/kg MS). *Milk income: This milk income is the farmers best estimate of their likely net milk sales. It may or may not be out of date based on new information from Dairy Companies. It does not necessarily reflect DairyNZs milk price forecast.
|
1,409,400 | 12.26 | 4,145 | 8,389 |
| Net Dairy Livestock Sales
Based on approx 55 MA Jersey cows and 8 empty R 2 heifers @ $650/hd, 11 R 2 bulls @ $1000, and 260 Bobbies at $20. Any animals born after 2020 are sold as organic meat so receive a premium of $100/head at slaughter. The budgeted per cow prices take into account that more animals sold are qualifying for organic premiums.
|
58,000 | 0.50 | 171 | 345 |
| Other Dairy Cash Income
Includes grazing for 54 yearlings, from second organic farm near the coast, for 52 weeks.
|
35,000 | 0.30 | 103 | 208 |
| NET DAIRY CASH INCOME | 1,502,400 | 13.06 | 4,419 | 8,943 |
| EXPENSES | $TOTAL | $/KgMS | $/COW | $/HA |
| Wages (incl. ACC)
This is the payment to the contract milkers. Their input should equate to about 1.6-1.8 FTE's. The contract milkers are responsible for paying for the shed electricity and shed consumables. This is their first season on farm.
|
202,700 | 1.76 | 596 | 1,207 |
| Animal health
Focus is on prevention rather than cure. The approach to animal health is kept simple and is based on good observation. The farm has good infrastructure so things like lameness are not an issue. Calving is Jersey on Jersey so there are fewer calving related difficulties/vet visits. Standard minerals are used and required vaccinations are carried out, (Lepto). BVD not a problem - milk test is used. Calf horn de-budding is included in animal health costs. Johnes testing is done annually from herd test milk samples. Incidence is low now and there are no clinical signs of the disease. As part of being fully organic certified and as a participant in the Well Farm programme, the herd will be independently condition scored, (by vets), four times a year. BCS at end of May 2024 was 4.5.
|
42,300 | 0.37 | 124 | 252 |
| Breeding and herd improvement
Includes the cost of DNA testing calves 90-95 calves and herd testing. Mating is AB for 10 weeks. 11 R 1 bulls are used on the heifers. With information for heat detection now supplied by Halter, AB is used for the herd for the whole of mating. Also included in this expense is registration of about 80-85 heifer calves with the breed society Jersey NZ.
|
34,100 | 0.30 | 100 | 203 |
| Farm dairy
The contract milker pays for all shed consumables.
|
700 | 0.01 | 2 | 4 |
| Electricity (farm dairy, water supply)
This includes the cost of access to the water scheme that provides all the farm water via gravity feed. The water supply is $4,500. Shed/farm Power is payed for by the contract milkers.
|
5,300 | 0.05 | 16 | 32 |
| Supplements made (incl. Contractors)
Only genuine surpluses harvested off the 168 ha. For 2025-226 the budget is based on 400 bales of hay, (15 bale equivalents) @15/bale for an external contractor doing the baling plus about $1,000 for raking.
|
6,800 | 0.06 | 20 | 40 |
| Calf rearing
This is for the costs for bedding and sundry equipment. The plan is to rear 85-87 replacement heifer calves and 9-11 bull calves. Calves are reared on colostrum, whole milk, pasture and hay. This has been the practice for the last 4 years and it has worked well. As an organic farm calves must be reared for 12 weeks.
|
1,600 | 0.01 | 5 | 10 |
| Young and drystock grazing
Not required as all young stock - approx 95-100 weaner heifers and bulls, 86 R 2 heifers and 11 R 2 bulls, (until summer), are grazed on 55 ha of the farm. This area also will provide winter grazing for the herd, grazing for 54 yearlings from a second organic farm for 52 weeks, plus all the hay, (400 bales 15 bale equivalents), for the herd and young stock. The 55 ha are not quite adjacent to the milking area so having additional young stock there greatly reduces the need to move milking cows along a public road.
|
0 | 0.00 | 0 | 0 |
| Fertiliser (incl. N)
Fertiliser for the farm is based on organic fish, seaweed and humates. A fit for purpose spreader is owned so spreading is all done in house. Cost includes 2,300 for soil testing. And includes trace minerals and cropping fertiliser.
|
31,700 | 0.28 | 93 | 189 |
| Regrassing & cropping
Much of the farm has now been planted with multi species pastures and a small area continues to be cropped each year. The 2025-26 plan is to plant another 6 ha of multispecies summer crop, which will morph into permanent pasture. The budget also allows for some seed for a bit of remedial reseeding should there be damage during periods of very wet weather. Planting practices used have the aim of producing a better seed bed with improved soil to seed contact. Cultivation and seed bed preparation involves two passes with a speed disc, 3 passes with a shallow disc followed by broadcasting the seed, applying fertiliser, (Oceanbase/lime with trace minerals), and then rolling. Establishment using this method has been great and yields good, but costs are higher.
|
7,200 | 0.06 | 21 | 43 |
| Weed and pest
Weeds and pests are not usually a problem. Weed control is a combination of manual control or an organic spray. The spray is mainly used for gorse on the river boundary. This cost also includes equipment and supplies for organic pest trapping and control. Included is an allowance for more gorse mulching, approx. $5,000.
|
5,700 | 0.05 | 17 | 34 |
| Vehicles & fuel
Do most of the harvesting and tractor work so includes the fuel costs associated with that work. Includes $14,000 for fuel.
|
24,200 | 0.21 | 71 | 144 |
| R&M (land, buildings, plant, machinery)
The budget has been prepared on a business as usual basis, so basic maintenance is allowed for. It does include $22,500 for shelter and tree planting - part of the farm planting plan completed 2 years ago. A lot R & M is done in house, so reliance on contractors is minimal. The R and M budget will be reviewed in 6 months and if cashflow is looking good then it could increase by about $35,000, as the cowshed is getting to a point of needing a new roof and if finances allow, another lahar could be removed.
|
58,600 | 0.51 | 172 | 349 |
| Freight and general farm expenses
Includes costs for protective clothing, bio-security supplies, (disinfectant, brushes etc), rubbish disposal, dead cow removal and bio-security levy, (now $0.008/kgMS).
|
7,000 | 0.06 | 21 | 42 |
| Administration
Do own GST, PAYE and budgeting. Includes administration and accounting fees for two financial entities, $2,000 for Organic auditing fees which is an annual requirement for Organic certification, plus travel costs relating to visiting other organic farms and organisations as part of continued learning about organic farming.
|
26,100 | 0.23 | 77 | 155 |
| Insurance
Includes: milk losses, loss of cows, public liability and property. This is something that is reviewed annually to make sure it is still relevant. Includes discounts for a good history of no claims.
|
25,000 | 0.22 | 74 | 149 |
| ACC
All cover is with a private insurer and is not included in the farm budget.
|
0 | 0.00 | 0 | 0 |
| Rates
As per rates demand.
|
19,000 | 0.17 | 56 | 113 |
| Halter
Halter subscription costs for 340-350 cows, paid in advance in one lump sum, so get one month free. Includes upgrade to a more inclusive package.
|
52,500 | 0.46 | 154 | 313 |
| TOTAL FARM WORKING EXPENSES | 550,500 | 4.79 | 1,619 | 3,277 |
| CASH OPERATING SURPLUS | 951,900 | 8.28 | 2,800 | 5,666 |
Non-cash adjustments have been included below the cash analysis to enable fairer comparisons to be made between farms. These adjustments are not part of a cash budget but are important to fully understand the efficiency of the farm business.
| $TOTAL | $/KgMS | $/COW | $/HA | |
| Value of change in dairy livestock
Expect to end the season with 7more R 2 heifers, and 5 more MA cows. IRD NMAV, (National Average Market Values), for 2025 are used to estimate the value of change in dairy livestock numbers. Net livestock income, (cash and non-cash), equates to $0.70/ kg MS.
|
23,300 | 0.20 | 69 | 139 |
| Labour adjustment
This is for 0.40-0.50 FTE, (1,000-1,200 hours), of unpaid labour input from the business owners and family. This covers 12 weeks of calf rearing, fertiliser applications, cropping, harvesting and building and general farm maintenance work. With this season being the first year for the contract milkers, more time on farm has been allowed to cover the time spent familiarising them with the farm, Halter and the requirements of certified organic farming.
|
40,000 | 0.35 | 118 | 238 |
| Feed inventory adjustment
Expect to have no significant difference in opening and closing feed on hand for the season, (45 t DM of hay opening and closing).
|
0 | 0.00 | 0 | 0 |
| Depreciation
As per financial statements for 2023-24 year, with allowance made for two more years depreciation. There are no significant asset purchases planned for the 2025-26 season.
|
30,000 | 0.26 | 86 | 179 |
| DAIRY GROSS FARM REVENUE | 1,525,700 | 13.27 | 4,487 | 9,082 |
| DAIRY OPERATING EXPENSES | 620,500 | 5.40 | 1,825 | 3,693 |
| DAIRY OPERATING PROFIT | 905,200 | 7.87 | 2,662 | 5,388 |
2024-25 season review (May 2025)
Numbers at a glance
Click here for PDF of season review
| Financial KPI's | Budget | Updated forecast |
| Milk Production (kgMS/ha) | 685 | 544 |
| Milk Production (kgMS/cow) | 329 | 261 |
| Net Dairy Cash Income ($/kgMS) | $11.05 | $14.72 |
| Total Farm Working Expenses ($/kgMS) | $3.46 | $4.62 |
| Cash Operating Surplus/Deficit ($/kgMS) | $7.59 | $10.11 |
| Gross Farm Revenue ($/kgMS) | $11.09 | $14.53 |
| Operating Expenses ($/kgMS) | $4.61 | $6.42 |
| Operating Profit ($/ha) | $4,432 | $4,409 |
Comments and points of interest
Key points
Comments
The season prior to the end of December was good with average rainfall that was well distributed, and with plenty of sunshine days in winter. Pasture growth from June to December has been in line with a good average for the farm.
Late January to mid-April was dominated by very hot, dry conditions with Taranaki declared a drought in late February. Compared with some Taranaki droughts, this drought took hold very suddenly and was quite severe, but relatively short in duration for this farm.
Pastures recovered well once it started to rain in early April. The farm went from desert in early April to lush green pasture in under 6 weeks.
Peak cows milked was 350, as per budget. The herd peaked at 1.9 kg/cow per day on pasture which is similar to last season.
Production for the season was 91,395 kgMS, well down on the budget for 115,000. Supplements fed for the season was 73 t DM which is on target.
7 ha of a 22 multi species crop was planted in the spring. Establishment was very good, yields for the first grazing were great, with the crop providing a bulk of feed through January and early February.
The second grazing in April was affected by the drought, and it was interesting to see the difference in species between the paddock graze first in January that had some rain on it and the second paddock that did not. The first paddock still had significant radish and other species while the second paddock chicory was the only species that really contributed to the feed supply.
Planting practices differed from previous years with the aim of producing a better seed bed with improved soil to seed contact. Cultivation and seed be preparation involved two passes with a speed disc, 3 passes with a shallow disc followed by broadcasting the seed, applying fertiliser, (Oceanbase/lime with trace minerals), and then rolling.
This increased the cost of cropping as contractors were used for some of the discing but the results were worth it given the better establishment and early yields.
Also, in April, 15 ha were oversown with multi species seed, (added to fertiliser) and 7 ha was undersown with oats/mixed grasses, (an experiment as had seed left from other farm).
Hay harvested this year has yielded 325 bales, (15 bale equivalent), off 31 ha. This is 75 fewer bales than last season and budget, (400 bales).
The herd went on to once a day milking on December 6th, (similar time to last season). This was for lifestyle reasons and to benefit the cows.
Individual cow condition scoring was done mid-February by the vet, with information provided for individual cow dry off dates based on condition score and calving date, (not actually used because of the drought!). All culls had left the farm by late February which left about 285 cows to be milked through.
With no rain in the foreseeable future, and pasture cover and cow condition dropping rapidly all the herd were dried off on March 10th. This is the second time the herd has been all dry before April in 20 years on the farm. The first was in the 2017-18 season when the herd dried off in late December after an extremely wet early spring and a very dry late spring/early summer.
Halter costs are up nearly $20,000 as at the 2 year contract review there was a slight per cow increase in prices which had not been factored into the original budget, but also the option was taken to subscribe to a more inclusive package which provides more information. The cost is now about $0.47/kg MS instead of $0.30/kg MS, (on an average year’s production of 115,000kg MS).
With the staff accommodation empty, the opportunity was taken to renovate the kitchen. There were also unforeseen repairs needed to the owners dwelling due to failure of waterproof membranes in bathroom. This increased R & M costs by $23,000.
Insurance costs are 15% below budget because a good no claims history kept the premiums down.
The permanent employee moved to a new job in October and was not replaced. Some casual labour was employed from October to December with the shareholders picking up more of the work load. With the drought and early drying off date total labour requirements for the farm were down so the increased work load was not too onerous.
Current Situation
There has been good rainfall in the last 2 weeks, (90 mm), and soil temperatures are still warm, so pasture is growing well.
Pasture cover is 2,300 kg DM per ha, and with pasture growth rates of 35 kg DM/ha/day, cover is lifting. Estimated feed requirements for the farm are currently at about 25 kgDM/ha/day. The grazing rotation is 70 days, and will go out to 100 days once cover reaches 2,500 later this month.
There are 281 MA cows on farm along with 66 R 2 in calf heifers, 97 R 1 heifers and bulls and 48 R 2 heifers from the second farm. The R 2 heifers will leave this week and be replaced with 54 R 1 heifers.
Cow body condition score is at about 4.3 which is lower than previous years but given the drought, is still very good. The MA cows are currently getting fed 11 kg MD/c/day of pasture which should achieve 0.5 CS gain in a month.
There is 45 t DM of hay still on hand to take into the 2025-26 season for calving and the spring.
Calving and reproduction
The heifer empty rate was about double the expected rate with 12 empty heifers out of 86 animals. The reason at this stage is still unknown.
Other points of interest
Environment
2024-25 mid season update (January 2025)
17th January 2025
| Financial KPI's | Budget | Updated forecast |
| Milk Production (kgMS/ha) | 685 | 685 |
| Milk Production (kgMS/cow) | 329 | 329 |
| Net Dairy Cash Income ($/kgMS) | $11.05 | $13.56 |
| Total Farm Working Expenses ($/kgMS) | $3.46 | $3.52 |
| Cash Operating Surplus/Deficit ($/kgMS) | $7.59 | $10.04 |
| Gross Farm Revenue ($/kgMS) | $11.09 | $13.63 |
| Operating Expenses ($/kgMS) | $4.61 | $4.99 |
| Operating Profit ($/ha) | $4,432 | $5,914 |
Click here for PDF of updated budget
Key points
Comments
The winter, spring and early summer have been good this year. Rain fall has been a good average and well distributed, with plenty of sunshine days in winter. Pasture growth from June to December has been in line with a good average for the farm.
Production to December 31st is 72,969 kg MS which is 3.5%, (2,500 kgMS), up on last season. Peak cows milked is 350 is on budget and 8 more than last season.
Supplements fed for the season is 35 t DM which is on target and leaves 10 t DM of hay still on hand. The herd peaked at 1.9 kg/cow per day on pasture which is similar to last season.
7 ha of a 22 multi species crop have been planted. Establishment has been very good and yields are looking great.
Planting practices differed from previous years with the aim of producing a better seed bed with improved soil to seed contact. Cultivation and seed be preparation involved two passes with a speed disc, 3 passes with a shallow disc followed by broadcasting the seed, applying fertiliser, (Oceanbase/lime with trace minerals), and then rolling.
This has increased the cost of cropping as contractors were used for some of the discing but the results are worth it as the crop has established well and the yields are better than past years.
Hay harvested this year has yielded 325 bales, (15 bale equivalent), off 31 ha. This is 75 fewer bales than last season and budget, (400 bales).
The herd went on to once a day milking on December 6th, (similar time to last season). This is for lifestyle reasons and to benefit the cows.
Following milk testing for Johnes and Staphylococcal levels an early cull of cows was done with 5 cows going in Mid-November and 12 in Mid-December. This took advantage of the higher cull cow schedule and brought cow numbers down to 333.
Fertiliser applied to date is on budget.
With current weather forecasts and dry soil conditions there could still be a tough summer and autumn ahead. Therefore, even though both production and payout forecasts are currently up on budget milk production for the season has been kept at 115,000 kg MS,
Income is forecast to be about $280,000 up on budget due to better than expected milk price and better livestock prices. If the weather stays dry and milk production finishes 10,000 kgMS lower than the 115,000 budgeted, (ie the same as last season), milk income will still be above budget.
Halter costs are up nearly $20,000 as at the 2 year contract review there was a slight per cow increase in prices which had not been factored into the original budget, but also the option was taken to subscribe to a more inclusive package which provides more information. The cost is now about $0.47/kg MS instead of $0.30/kg MS.
Insurance costs are 15% below budget as having a good no claims history kept the premiums down.
Current Situation
Current daily production is similar to last season, (and budget). The herd is producing 1.35 kg MS/cow/day, having been on once a day milking since December 6th. Cow intakes are about 16 kg DM/cow/day of mixed species pasture. Cow condition score is probably about 4.5 is a bit better than last season.They were scored by the vets 2 months ago and were at 4.79 BCS which was very good. There are currently 333 cows in the milking herd, down slightly on the same time last season.
Pasture cover, as at December 31st, was 2,300 kg DM per ha, and with pasture growth rates of 70 kg DM/ha/day cover was lifting. The grazing rotation is 30 days with the hay paddocks still to come in. This is similar to the same time last year but in the last 2 weeks growth rates will have dropped as there has been no rain since early January.
There are 132 rising 2 year old heifers, 86 replacement weaners and 11 weaner bulls on farm. This is about 15 fewer R 2 heifers than last year so grazing pressure is not quite as high this season. The weaners are run 10 days ahead of the milking herd and the R 2’s are being break fed with a back fence.
Conditions have been drying out very quickly since early January. Rain forecast for next week will be crucial. Farming on the coast, late summer/autumn dry conditions are expected but hopefully not too severe.
Looking forward
The philosophy for summer is not to feed supplements to any animal that won’t be in the herd for the next season so culls will go early. Drying off will be based on the autumn/winter feed budgets, and will ensure that cow condition and feed cover targets for the end of May and at calving will not be compromised.
There is about 38 t DM of hay available for use this season which similar to last year. The 7 ha of multi species crop is growing well and should provide about 4 weeks of feed for the herd in late January/early February, with a second grazing in April. The crop will then morph into permanent pasture so will not be out of the grazing rotation after the second grazing.
Once empty cows have been confirmed in mid-February 25-30 cows can be culled, with space already booked. This will bring stock numbers down to about 300 by late February. Getting culls away early means they go while prices are still reasonably high and it frees up more feed for the remaining cows.
Individual cow condition scoring is done mid-February by the vet who then sends a template with individual cow advised dry off date based on condition score and calving date.
Calving and reproduction
Other points of interest
Environment
2023-24 season review
| Financial KPI's | Budget | Updated forecast |
| Milk Production (kgMS/ha) | 661 | 622 |
| Milk Production (kgMS/cow) | 329 | 306 |
| Net Dairy Cash Income ($/kgMS) | $10.97 | $13.00 |
| Total Farm Working Expenses ($/kgMS) | $3.14 | $3.68 |
| Cash Operating Surplus/Deficit ($/kgMS) | $7.83 | $9.33 |
| Gross Farm Revenue ($/kgMS) | $11.02 | $13.04 |
| Operating Expenses ($/kgMS) | $4.29 | $4.96 |
| Operating Profit ($/ha) | $4,448 | $5,031 |
Click here for PDF of 2023-24 season review
Key points
• 2023-24 was the first season running the farm as two separate blocks; 113 ha with 340-360 milking cows and utilising 55 ha of the farm as a support block providing winter grazing for the herd, and grazing for the farms yearlings and weaners as well as an additional 50-55 yearlings from a second organic farm.
• Pasture and crop harvested for the season is 10.6 t DM/ha which is slightly less than the previous year, (10.8 t DM/ha).
• Well distributed average rainfall and plenty of sunshine days in the winter helped to set up a good start to the season, with production being up on budget by the end of December.
• A more normal dry weather pattern for the late summer and autumn resulted in a “green” drought with final milk solids for the season 9% behind budget.
• The last of the herd were dry by the end of April.
• Milk price received to the end of June will be $11.99/kgMS, (including deferred income and dividends). This is 1.89/kgMS up on budget.
• Operating expenses, (opex), and Farm working expenses, (FWE), are estimated at $4.95-$5.00/kg MS for opex and $3.65-$3.70/kgMS for FWE.
• Operating Profit/ha is around $5,031/ha, up 9% on budget.
• Higher interest rates have impacted cash flow so total cash surplus for the year, after interest, debt repayment, tax and drawings is down on last season.
• Halter continues to deliver savings in time involved with collecting information required for making stock and pasture management decisions.
Comments
Production for the season was 104,524 kg MS, 9% down on budget. Peak cows milked of 342 were 8 less than budget.
Pasture growth from June to December was been better than previous years and spring growth was on target. November had a higher than average rainfall but there were many windy and sunny days in between so conditions never got too wet.
Supplements fed for the season is 44 t DM of hay from inventory, the majority of which was fed in the winter and spring.
90 t DM of hay was made in the summer on the 55 ha support area, with 40 t DM still on hand.
The herd peaked at 1.8 kg MS/cow/day which is well up on the previous year, (1.5 kgMS/cow/day).
6.36 ha of multi species crops were planted in the spring as per budget and provided about 4 weeks grazing for the milking herd in February.
The 8 ha of deferred grazing set aside for the heifers worked well for summer/autumn grazing. The area deferred was last year’s summer multi species crop. The resulting big seed drop, germination and regrowth from this has been excellent and has helped consolidate the pasture.
The herd went on to once a day milking on December 8th, (similar time to last season), for lifestyle reasons and to benefit the cows.
The bulk of culling occurred in mid to late February after pregnancy testing. Herd numbers were down to 280 cows by the end of February.
A drying off plan was developed with the help of the vets based on body condition score and calving date. With the continuing dry weather the plan was brought forward and the first cows were dried off 21st March and the last 180 by 26th April.
Having information from Halter has made decision making so much easier. In August Pasture pro was released and this has now replaced other methods of pasture cover and growth rate assessment.
The capital payment from Fonterra in August made a big difference to the cash flow and helped to mitigate the impact of the drop in the advance rate at that time.
Current Situation
Pasture cover is 2,440 kg DM/ha, and with current pasture growth rates of 35 kg DM/ha/day cover is holding. Cow condition was independently assessed at the end of May as being a BCS of 4.3, (excluding the in calf heifers).
In addition to the 364 MA cows and in-calf heifers for the coming season, there are 4 empty heifers, (for meat), 133 rising 1 year old heifers and 9 rising 1 year old bulls on farm.
Soil moisture levels are still reasonable for this time of year as rainfall for May was below average.
Calving and reproduction
• The calving pattern for the 23-24 season was 52% after 3 weeks, 73% after 6 weeks and 91% after 9 weeks. This is similar to the previous season and is till slower than ideal.
• Relied solely on Halter information to identify cows in heat this season, which made for a stress free mating period.
• Submission rates for the first 3 weeks were 84%, (as per MINDA), which is up on last season, (80%).
• With heat detection for mating easier, the bulls were removed from the herd early and 10 days of AB with short gestation bulls was carried out. This meant mating finished 8 days earlier than planned on December 24th. It also means fewer bulls need to be reared as herd bulls in the future.
• Actual 6 week in calf rate as per MINDA is 65%, slightly better than last season (62%).
• Last season, only cows identified as possibly empty on Halter were pregnancy tested. There were no late empties identified in the winter and early spring so this process was followed again in February. This has significantly reduced the cost required for pregnancy testing.
• The not in calf rate, (as per MINDA) was 13%.
• Fewer bulls are needed now with lower yearling heifer numbers for next spring and the plan to use all AB for the herd.
Other points of interest
• As part of the Welfarm programme the herd body condition score was again assessed four times over the year. (Pre-calving, pre-mating, mid-February and at drying off).
• In addition the whole herd undergoes an annual tail scoring and a locomotion assessment, (lameness). There have only been 7 lame cows all season with 5 of these occurring in one week. They all quickly recovered after being removed from the herd for a short time.
• Somatic cell count for the season was 196,000 which is up on previous years. This is frustrating as there were fewer clinical cases of mastitis, particularly in the latter part of the season. Investigations as to the source have identified stray voltage coming into the shed but efforts to mitigate this have been unsuccessful so far.
• An increase in wages paid for the year was the main cause of increases in farm working expenses. Total paid labour on the farm was up about 0.35 FTE. The budget was for the permanent staff member to work 0.6 FTE, but they actually were closer to 0.7 FTE. For 2023-24 have been employing son at part time so labour on the farm has increased by about 0.26 FTE.
• Weed and pest expenditure was well above budget as a gorse mulcher and operator were hired to clear areas of gorse on inaccessible lahar slopes. This has been money well spent as this area can now be controlled with stock grazing and will be more productive.
• Debt repayment has continued despite pressures on cash flow from higher interest rates.
Environment
• There are no outstanding actions on the Fonterra Farm Environment plan.
• The tree planting plan was put on hold when interest rates started to rise.
• Continued maintenance of existing plantings was done in the autumn.
2021-22 season review
| Financial KPI's* | Budget | Actual |
| Milk Production (kgMS/ha) | 774 | 762 |
| Milk Production (kgMS/cow) | 325 | 326 |
| Net Dairy Cash Income ($/kgMS) | $8.06 | $10.46 |
| Total Farm Working Expenses ($/kgMS) | $2.28 | $2.95 |
| Cash Operating Surplus/Deficit ($/kgMS) | $5.78 | $7.51 |
| Gross Farm Revenue ($/kgMS) | $8.13 | $10.35 |
| Operating Expenses ($/kgMS) | $3.20 | $3.87 |
| Operating Profit ($/ha) | $3,811 | $4,939 |
*These KPI's are based on cash book actuals to 31 May 2022 and estimated non-cash adjustments. The final financial performance based on financial statements may differ.
Click here for PDF of 2021-2022 budget v actuals
2020-21 season review
| Financial KPI's* | Budget | Actual |
| Milk Production (kgMS/ha) | 774 | 792 |
| Milk Production (kgMS/cow) | 325 | 326 |
| Net Dairy Cash Income ($/kgMS) | $8.81 | $9.52 |
| Total Farm Working Expenses ($/kgMS) | $2.78 | $2.65 |
| Cash Operating Surplus/Deficit ($/kgMS) | $6.03 | $6.87 |
| Gross Farm Revenue ($/kgMS) | $8.75 | $9.19 |
| Operating Expenses ($/kgMS) | $3.63 | $3.52 |
| Operating Profit ($/ha) | $3,965 | $4,493 |
*These KPI's are based on cash book actuals to 31 May 2021 and estimated non-cash adjustments. The final financial performance based on financial statements may differ.
Click here for PDF of 2020-2021 budget v actuals
Other points of interest
2019-20 season review
| Financial KPI's* | Budget | Actual |
| Milk Production (kgMS/ha) | 774 | 653 |
| Milk Production (kgMS/cow) | 325 | 273 |
| Net Dairy Cash Income ($/kgMS) | $8.19 | $9.45 |
| Total Farm Working Expenses ($/kgMS) | $2.57 | $3.06 |
| Cash Operating Surplus/Deficit ($/kgMS) | $5.63 | $6.39 |
| Gross Farm Revenue ($/kgMS) | $8.07 | $9.58 |
| Operating Expenses ($/kgMS) | $3.40 | $4.05 |
| Operating Profit ($/ha) | $3,614 | $3,609 |
*These KPI's are based on cash book actuals to 31 May 2020 and estimated non-cash adjustments. The final financial performance based on financial statements may differ.
Click here for PDF of 2019-2020 budget v actuals
Other points of interest
2018-19 season review
| Financial KPI's* | Budget | Actual |
| Milk Production (kgMS/ha) | 774 | 743 |
| Milk Production (kgMS/cow) | 325 | 324 |
| Net Dairy Cash Income ($/kgMS) | $6.76 | $6.40 |
| Total Farm Working Expenses ($/kgMS) | $2.31 | $2.72 |
| Cash Operating Surplus/Deficit ($/kgMS) | $4.46 | $3.68 |
| Gross Farm Revenue ($/kgMS) | $6.71 | $6.55 |
| Operating Expenses ($/kgMS) | $3.24 | $3.63 |
| Operating Profit ($/ha) | $2,684 | $2,173 |
*These KPI's are based on cash book actuals to 31 May 2019 and estimated non-cash adjustments. The final financial performance based on financial statements may differ.
Click here for PDF of 2018-19 budget v actuals
Other points of interest
2017-18 season review
The first half of the 2017-18 season was defined by extreme weather conditions.
The very wet winter and spring and associated reduced pasture growth and utilisation saw the herd put on once a day in early October.
This was followed by a sudden change to extreme dry with less than 20% of the average rainfall falling from mid-October to early January.
Despite being on once a day milking since October and culling 14 % of the herd, the on farm situation in late December was critical, with very low pasture cover, no supplements made on farm and limited options for purchasing supplements due to the constraints with the conversion to Organic supply.
The decision was made to dry the whole herd off in late December with production at 41% of budget. This decision was not made lightly but was helped by having a strong balance sheet and good support from the bank.
The farm situation as at 31/5/2018 had the whole herd in condition score of 5.4+ and pasture cover of 2,900 kg DM per ha. Wintering 2018 was planned to be all grass with maintenance levels of feeding.
Given the season, the limitations for importing feed as an organic farm and the farm position going into the 2018 winter, the decision to dry off so early was definitely the right one for this farm, the people on the farm and the animals. It means that the physical effects of the poor season will not carry over to the 18-19 season, (or beyond).
2016-17 season review
| Financial KPI's* | Budget | Actual | Physical KPI's | 2016/17 |
| Net Dairy Cash Income ($/kgMS) | $5.00 | $6.38 | Milk Production (kgMS/ha) | 769 |
| Total Farm Working Expenses ($/kgMS) | $1.89 | $2.30 | Pasture and Crop Eaten (t DM/ha) | 12.4 |
| Cash Operating Surplus/Deficit ($/kgMS) | $3.11 | $4.08 | Imported Supplements & Dry Cow Grazing (% of total feed eaten) | 0% |
| Gross Farm Revenue ($/kgMS) | $4.93 | $6.41 | Six Week In-Calf Rate (*A=Actual E=Estimated) | 64% E |
| Operating Expenses ($/kgMS) | $2.76 | $3.21 | First Calvers on Farm End of Season(% of first calvers at start of season) | 81% |
| Operating Profit ($/ha) | $1,809 | $2,455 | Milksolids per Labour Unit (kgMS/FTE) | 49,819 |
*These KPI's are based on cash book actuals to 31 May 2017 and estimated non-cash adjustments. The final financial performance based on financial statements may differ.
Click here for PDF of 2016-17 budget v actuals
An unplanned staffing shortage in the autumn (2 IC off for 10 weeks due to a non-farming related accident), that also coincided with a difficult family time, put extreme stress on the business. Employing and successfully integrating new relief staff at this time was made easier having robust systems in place. Keeping things simple made it easier to cope when adversity struck.
We farm for profit and sustainability so our budget can cope with an 8 % variation in milk production. Operating profit would still have been over 1300 $/ha without the payout increase and including the $32446 increase in FWE.
Revenue was up due to the increase in milk price and better than expected stock prices, and most of the increase in farm working expenses was either a conscious decision to do catch up R & M or dealing with unplanned breakdowns.
Any additional cash surplus from this year has been used to reduce debt and strengthen the financial position of the partners.
Want to see how the top operators are spending their money? Are there areas for improvement in your own business where savings can be made? We’ve collected in-depth current season budgets from a number of top performing farms with a focus on lower ‘per unit’ cost of production to help you identify opportunities.
Now’s the perfect time to check in, plan, and set up for a strong season. We’ve pulled together smart tips and tools to help you stay ahead all winter long.
Whether you prefer to read, listen, or download handy guides, we’ve got you covered with trusted tools to support your journey every step of the way.
Put our proven strategies and seasonal tools to work. Boost production, support animal health and watch your profits hum.
Tools that are backed by science, shaped by farmers and made for this season.
That’s Summer Smarts.
Autumn Smarts brings together the research-backed tools that build resilience and boost performance.
The tools and insights you need to navigate the season with confidence. Backed by research and built for results – that’s Winter Smarts.


