Fertility BV Animal Model
Topics
7 min read
Fertility Breeding Value (BV) gauges a cow's genetic potential for fertility. A study formed a unique herd of heifer calves with varied Fertility BVs to understand its impact. Working with partners, researchers raised 550 heifers with either high or low Fertility BV in Taranaki. Findings revealed high Fertility BV heifers reached puberty sooner and had better reproductive outcomes than their low BV counterparts. Additionally, these high BV heifers showcased superior survival rates and had more favourable calving patterns. Monitoring these differences assists in optimising breeding programmes for enhanced productivity.
To test the robustness of the current Fertility Breeding Value (BV) and identify new measures of fertility, we generated a unique herd of heifer calves that had a 10-point difference in their Fertility BV (-5% vs +5%).

We observed remarkable differences in reproductive measures between high and low Fertility BV animals during rearing (2015-17), and their first (2017-18) and second (2018-19) lactations.
Find out more on how we conducted this study and the key results:
To identify new fertility traits, we worked with farmers and partners (including NZAEL, LIC and CRV Ambreed) to generate a unique research herd of 550 heifers with high (+5%) and low (-5%) Fertility BV. This required the contract mating of 2800 cows across the North Island (see Breeding Plan image below).
Breeding plan to generate heifer calves with divergent Fertility BV.
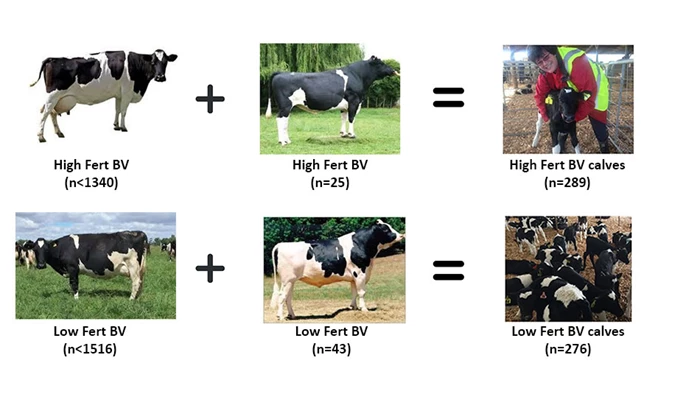
The heifers that make up the Fertility BV Animal Model are Holstein-Friesian. This breed has the greatest genetic diversity in the fertility trait, as well as the largest breed population in NZ.
The study herd were balanced for other traits such as live weight, milk production, and % North American ancestry.
640 heifer calves were collected from across the North Island within 9 days of being born and following DNA parentage testing, we retained 289 High and 276 Low Fertility BV calves for further study.
All animals were reared together in Taranaki for a standard 13-week period from birth to weaning. They were weaned on age, rather than liveweight, as we wanted to measure their growth rates as part of the study. They were then moved to a grazing unit just north of Auckland for the rest of their rearing period.
Heifers were studied closely to understand biological differences in their fertility during the rearing phase (2015-17), and their first (2017-18) and second (2018-19) lactations.
A key finding during rearing was the discovery that high Fertility BV heifers reached puberty at:
Because the two groups had a similar growth rate (see Figure 2), the earlier onset of puberty in the high Fertility BV heifers indicates that the biological “trigger” to start cycling is reached at a lower live weight in more fertile animals.
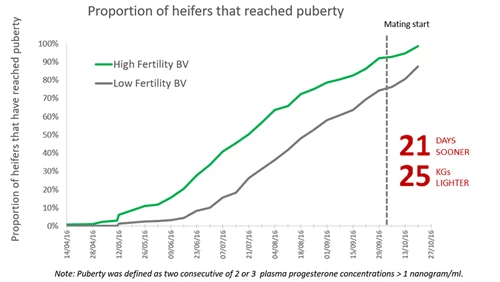
Figure 1. Cows with high Fertility BV achieve puberty at an earlier age and a lighter live weight than those with low Fertility BV.
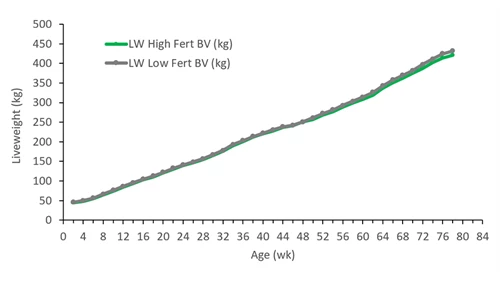
Figure 2: Heifers with high Fertility BV grew at the same rate as heifers with low Fertility BV.
The earlier onset of puberty in the high Fertility BV heifers meant that they had one more oestrus cycle before mating start date than low Fertility BV heifers.
This resulted in a greater percentage of high Fertility BV heifers cycling at mating start date relative to the low Fertility BV heifers (93% vs. 76%).
After three weeks of mating, 99% of the high and 87% of the low Fertility BV heifers had reached puberty and could be bred.
Overall, reproductive performance of the high Fertility BV heifers was superior to the low Fertility BV heifers.
Using dated pregnancy diagnosis, we estimated that 8% more high Fertility BV heifers were mated during the first 3 weeks of breeding than low Fertility BV heifers (97% vs 89%).
This resulted in more high Fertility BV heifers conceiving earlier in the mating period, with 9% greater 3-wk and 6-wk in-calf rates (Figure 3).
The final not-in-calf rate after 14 weeks of natural mating* was 2% vs 6% for high and low Fertility BV heifers, respectively.
*The maiden heifers were naturally mated to Jersey bulls for 14 weeks. We chose a relatively long mating period to ensure that enough low Fertility BV heifers conceived and remained in the herd for further study as lactating cows.
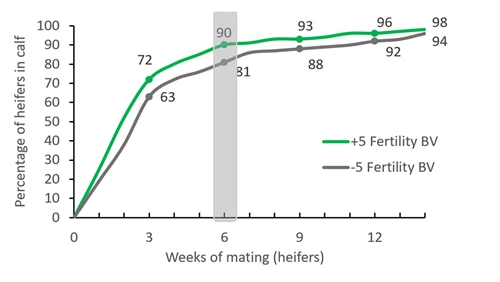
Figure 3: Heifer pregnancy rates for high vs low Fertility BV animals.
In both lactation 1 and 2, we used reproductive interventions for non-cycling only after 6 weeks of artificial breeding (AB) to enable animals to express their natural fertility.
High Fertility BV cows had approx. 35% greater 6-week In-Calf rates than low Fertility BV cows in lactations 1 and 2 (Figure 4). They also conceived earlier in the mating period: by 7 days in lactation 1 and 13 days in lactation 2.
This meant that high Fertility BV cows were 4 times more likely to be pregnant after 6 weeks of AB.
Final Not-In-Calf rates were very poor in the low relative to the high Fertility BV cows (approx . 40% vs. 14%; Figure 4a and b).
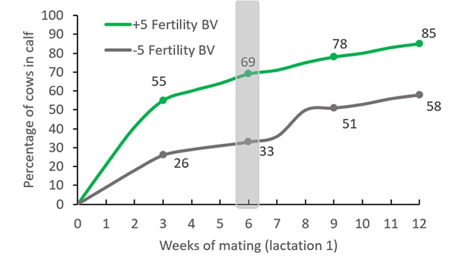
Figure 4a. Difference in pregnancy rates between High and Low Fertility BV cows during lactation 1.
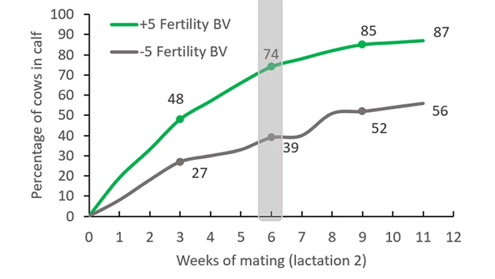
Figure 4b. Difference in pregnancy rates between High and Low Fertility BV cows during lactation 2.
The key drivers for the greater 6 week In-Calf rate in high Fertility BV cows were substantially greater:
| Pre-Mating Cycling Rate |
3-week Submission Rate |
6-week Submission Rate |
||
| Lactation 1 | High Fertility BV | 85% | 87% | 95% |
| Low Fertility BV | 39% | 48% | 54% | |
| Lactation 2 | High Fertility BV | 80% | 87% | 93% |
| Low Fertility BV | 43% | 55% | 64% |
The submission rates for low Fertility BV cows were extremely poor during both lactations 1 and 2 (Table 1). This was because a large percentage of low Fertility BV cows were still anoestrous (non-cycling) after 6 weeks of AB. Few of these cows could be rescued with CIDR treatments, indicating issues with prolonged and non-responsive anoestrous.
The low Fertility BV cows that cycled naturally (without interventions) still had a 9 day longer interval from calving to first ovulation. These results indicate that high Fertility BV cows have a significantly greater ability to resume cycling after calving.
During rearing, fewer high Fertility BV heifers were removed from the herd due to ill-health, poor conformation, and on-farm deaths (Table 2). Combined with their greater pregnancy rate, this meant that high Fertility BV heifers had a better survival rate than low Fertility BV heifers going into their first lactation (Table 2).
| High Fertility BV | Low Fertility BV | ||
| Removal reason | Died | 2% | 5% |
| Culled | 2% | 2% | |
| Unsound | <0.5% | <1% | |
| Freemartin | <0.5% | 1% | |
| Scanned not pregnant | 1% | 3% | |
| Remaining (March 2017) | 94% | 88% |
During lactations 1 and 2, there were similar pre- and post-calving animal removals due to slips, ill-health and other issues such as temperament and udder conformation (Table 3). However, large numbers of low Fertility BV cows were removed each year due to reproductive failure, which resulted in a poor survival rate between lactations (Table 3). After lactation 2, only a quarter of the low Fertility BV animals remained in the herd, whereas two-thirds of the high Fertility BV cows remained.
| High Fertility BV | Low Fertility BV | ||
| Number expected to calve lactation 1 | 271 (100%) | 242 (100%) | |
| Lactation 1 removals | Pre-calving | 4% | 5% |
| Post-calving | 1% | 2% | |
| Scanned not pregnant | 17% | 41% | |
| Number remaining and expected to calve in lactation 2 | 211 (78%) | 126 (52%) | |
| Lactation 2 removals | Pre-calving | 1% | <0.5% |
| Post-calving | 2% | 2% | |
| Scanned not pregnant | 10% | 22% | |
| Number remaining and expected to calve in lactation 3 | 175 (65%) | 68 (28%) | |
The greater 6-wk In-Calf rates in high Fertility BV heifers and cows translated to earlier and more condensed calving patterns during lactations 1 and 2 relative to low Fertility BV animals.
During lactation 1, high Fertility BV heifers calved, on average, 4 days earlier. They had a greater proportion of animals calved within the first 3 weeks after the planned start of calving (PSC; 82% high vs 75% low; Figure 5a). However, by 6 weeks after the PSC, a similar number of animals had calved in both groups (93%).
The re-calving pattern during lactation 2 was significantly better in high Fertility BV cows. On average, they calved 12 days earlier than the low Fertility BV group. A greater percentage of high Fertility BV cows calved within the first 3 weeks (62% high vs 41% low) and 6 weeks (82% vs 57%) after the PSC (Figure 5b). However, low and high Fertility BV cows had similar calving rates by 10 weeks (100%), due to the large number of low Fertility BV cows inseminated to CIDR-induced heats after 6 weeks of mating.
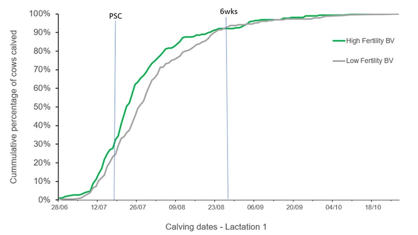
Figure 5a.
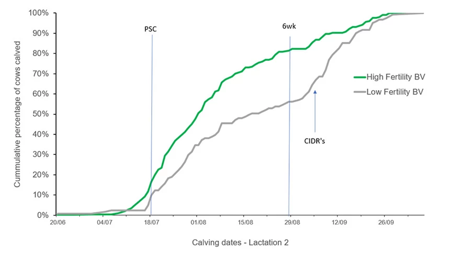
Figure 5b.
The poorer reproductive performance in low Fertility BV animals could not be explained by greater milk production relative to high Fertility BV animals. Differences in total milksolids yields during lactation 1 and 2 were less than 2%.
Similarly, the prolonged postpartum anoestrous interval in low Fertility BV animals was not driven by greater negative energy balance as there were no differences in metabolic indicators relative to high Fertility BV animals.
As this experiment was set up to test the effect of the Fertility BV trait, these results were not unexpected. This is because significant efforts were made to balance traits between the two groups, including milk production, live weight and BCS.
Does selecting bulls that have a high Fertility Breeding Value really improve your herd’s fertility? In this episode, DairyNZ senior scientist Susanne Meier talks about what we learned from studying a unique herd of heifers with high and low Fertility BV, during rearing and their first and second lactations.
Now’s the perfect time to check in, plan, and set up for a strong season. We’ve pulled together smart tips and tools to help you stay ahead all winter long.
Whether you prefer to read, listen, or download handy guides, we’ve got you covered with trusted tools to support your journey every step of the way.
Put our proven strategies and seasonal tools to work. Boost production, support animal health and watch your profits hum.
Tools that are backed by science, shaped by farmers and made for this season.
That’s Summer Smarts.
Autumn Smarts brings together the research-backed tools that build resilience and boost performance.
The tools and insights you need to navigate the season with confidence. Backed by research and built for results – that’s Winter Smarts.


